Queue Status
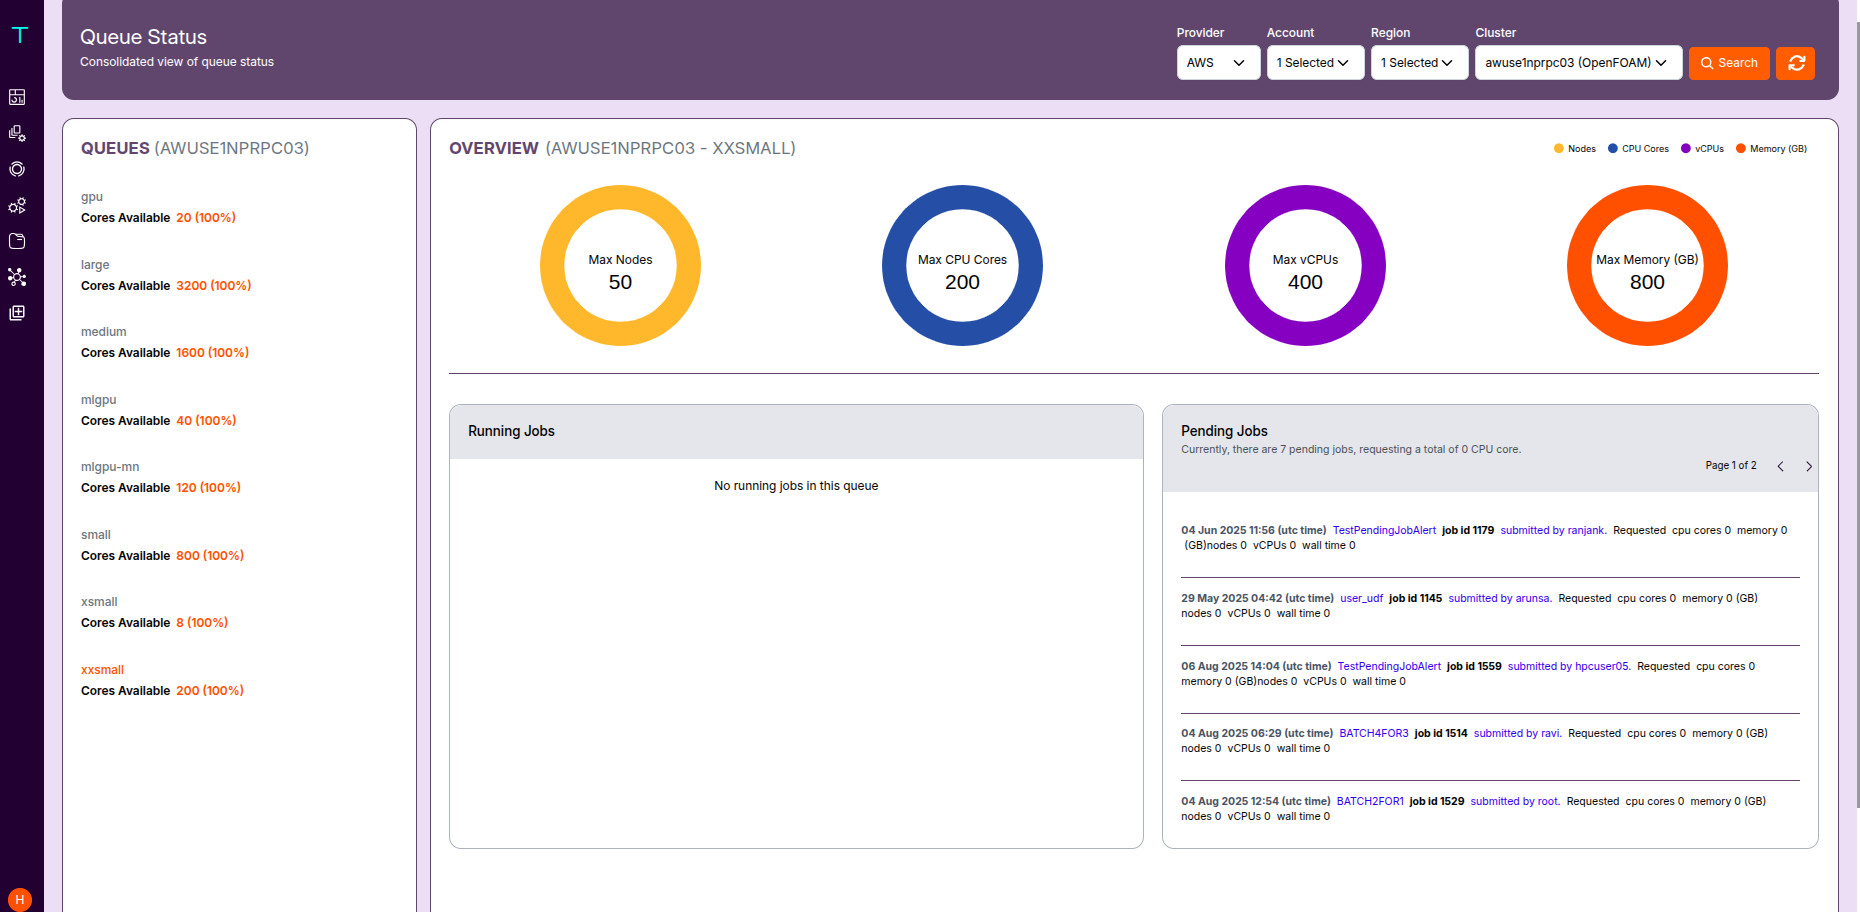
The Queue Status page provides a consolidated view of compute queue availability and job statuses within a selected cluster. It allows users to monitor node, CPU, vCPU, and memory resources along with currently running and pending jobs.
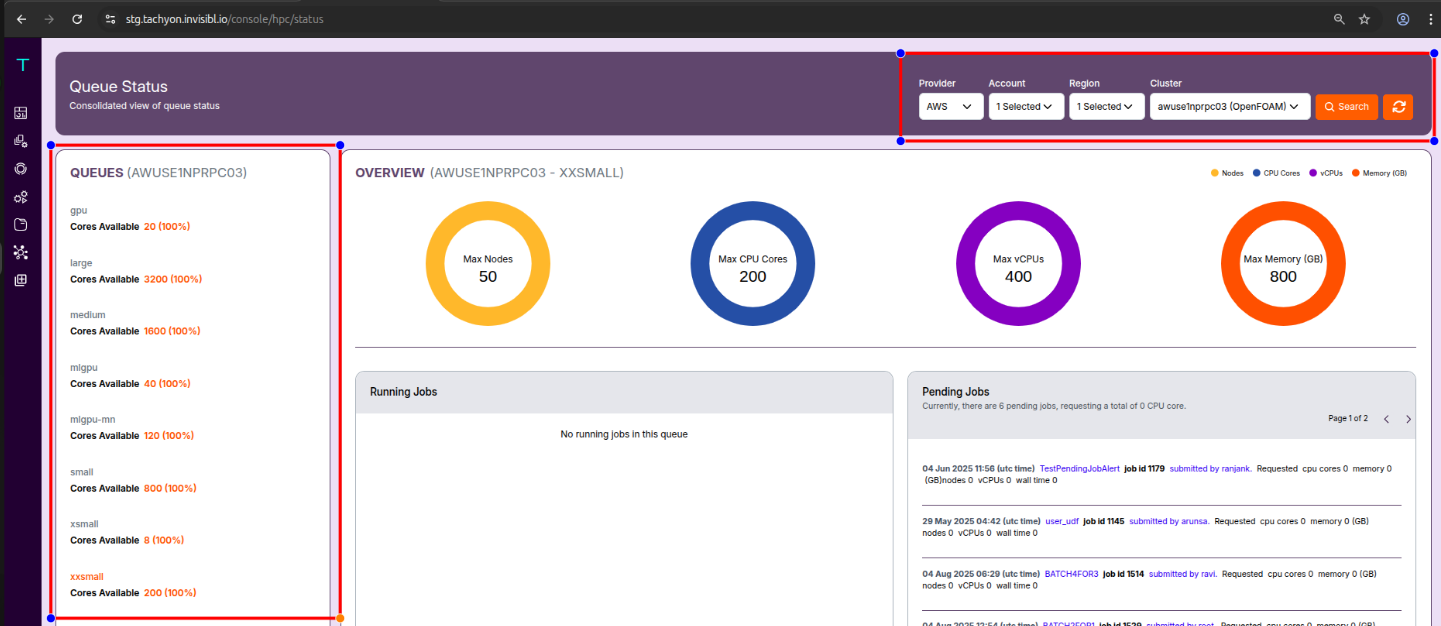
Accessing the Queue Status
To access the Queue Status page:
- Navigate to the Queue Status menu from the left panel.
-
Use the filter options at the top to select:
- Provider: Select the cloud provider (e.g., AWS)
- Account: Filter by specific cloud account
- Region: Filter clusters by region
- Cluster: Choose the cluster you want to monitor
- Duration: Date range selection (e.g., 01-Jul-2025 to 31-Jul-2025)
- Click the Search button to load the relevant queue data.

Overview Panel
This section displays circular donut charts representing cluster-wide resource limits:
- Max Nodes (Yellow)
- Max CPU Cores (Blue)
- Max vCPUs (Purple)
- Max Memory (GB) (Orange)
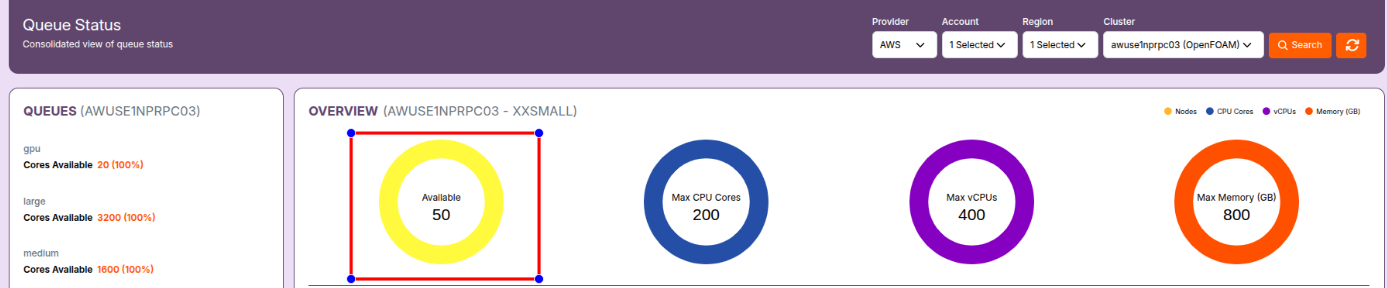
- 🟡 By default, the charts show the maximum available capacity. The donuts show Max values.
- 🎯 When hovering over any chart, a tooltip will display the current available or used value. Hovering over the donuts shows Available values such as available nodes or cores.
Queue Panel (Left Sidebar)
All available queues within the cluster are listed with resource availability indicators. Each queue displays:
- Queue name (e.g.,
gpu,large,medium,mlgpu, etc.) - Cores Available
- Usage Percentage (e.g.,
100%indicates full availability)
Running Jobs
The center panel titled Running Jobs shows a list of currently active jobs.
- If no jobs are running, it displays:
Job Details Displayed
For each running job, the following details are shown:
- Submit Time (UTC) – The timestamp when the job was submitted.
- Job Name – Name assigned to the job.
- Job ID – Unique identifier of the job.
-
Submitted By – The user who submitted the job.
-
Requested Resources — includes:
- Number of CPU cores
- Memory (in GB)
- Node count
- Estimated Wall Time – The maximum time the job is allowed to run.
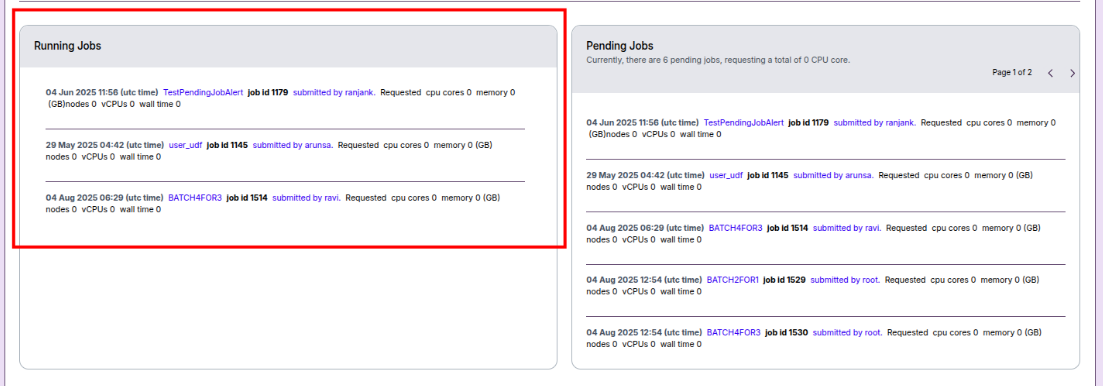
Pending Jobs
The Pending Jobs panel shows a list of jobs that are queued and waiting for execution in the selected queue.
Job Details Displayed
For each pending job, the following details are shown:
- Submit Time (UTC) – The timestamp when the job was submitted.
- Job Name – Name assigned to the job.
- Job ID – Unique identifier of the job.
-
Submitted By – The user who submitted the job.
-
Requested Resources — includes:
- Number of CPU cores
- Memory (in GB)
- Node count
-
Estimated Wall Time – The maximum duration for which the job is allowed to run.
- Values are refreshed each time the Search button is clicked.
- Donut chart tooltips are dynamic and provide real-time resource availability insights on hover.
- This page is especially useful to identify:
- Cluster congestion
- Resource starvation issues
- If you encounter any UI issues or have questions about job submissions or status, please contact the Admin for support.
- Ensure you have selected the correct cluster, region, and provider when filtering queue data.