🗂️ Project Dashboard
The Project Dashboard shows aggregated usage, cost, and performance data across all clusters linked to a project.
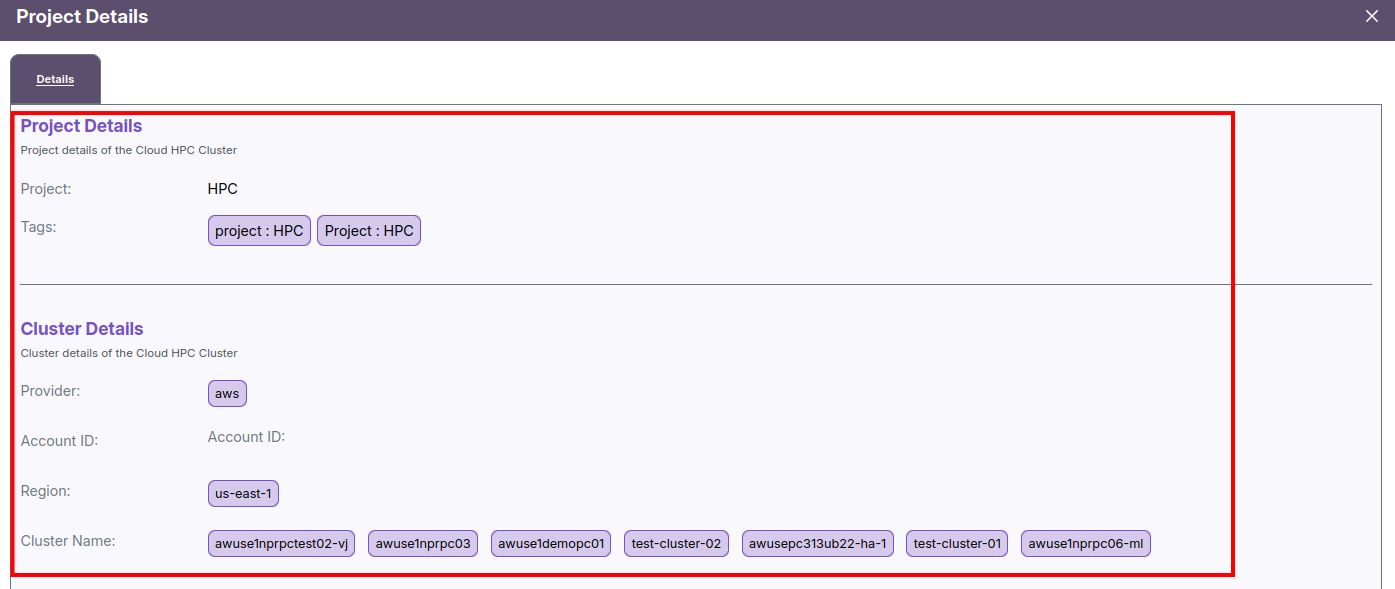
Project Details Popup
Selecting View Details for a project displays its configuration and related cluster mappings:
Project Name: HPC
Tags:
project : HPCProject : RND
Associated Clusters:
- test-cluster-01
- test-cluster-02
- If no cluster or cost data is available for the selected duration, the popup displays: No project information available for the selected period.
📈 Projects Dashboard Metrics
Projects Metrics view open when click on expand view near detail button. it will provide the entire resouse used under Projects like jobs, workstation, resources usages and so on.
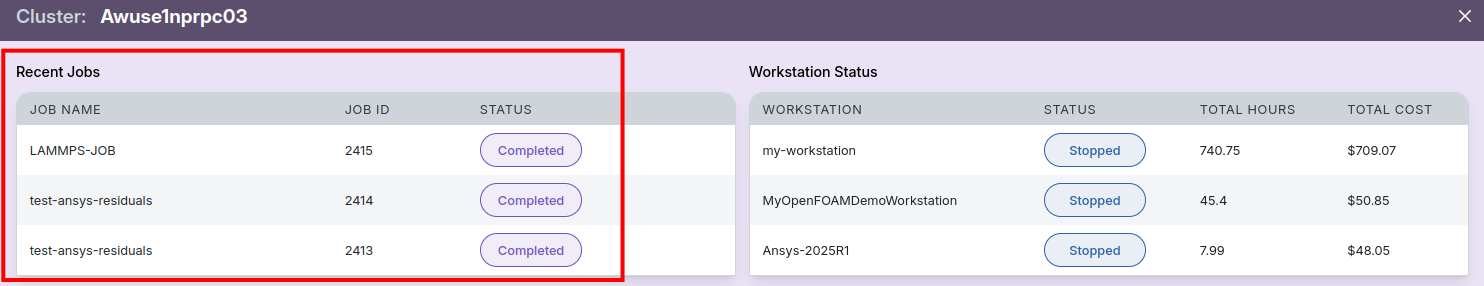
🧾 Recent Jobs
Displays job IDs, names, Projects, and completion states (Completed, Failed, Cancelled).
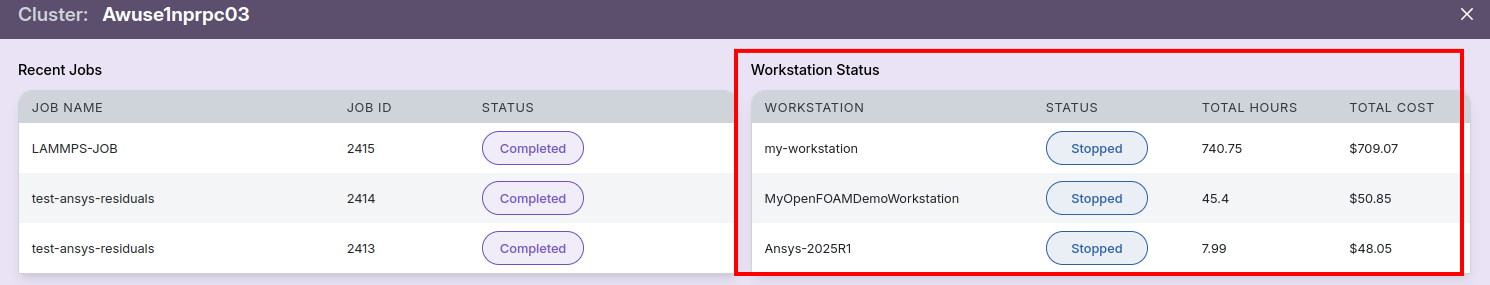
💻 Workstation Status
Lists all workstations with current state, usage hours, and cost breakdown.
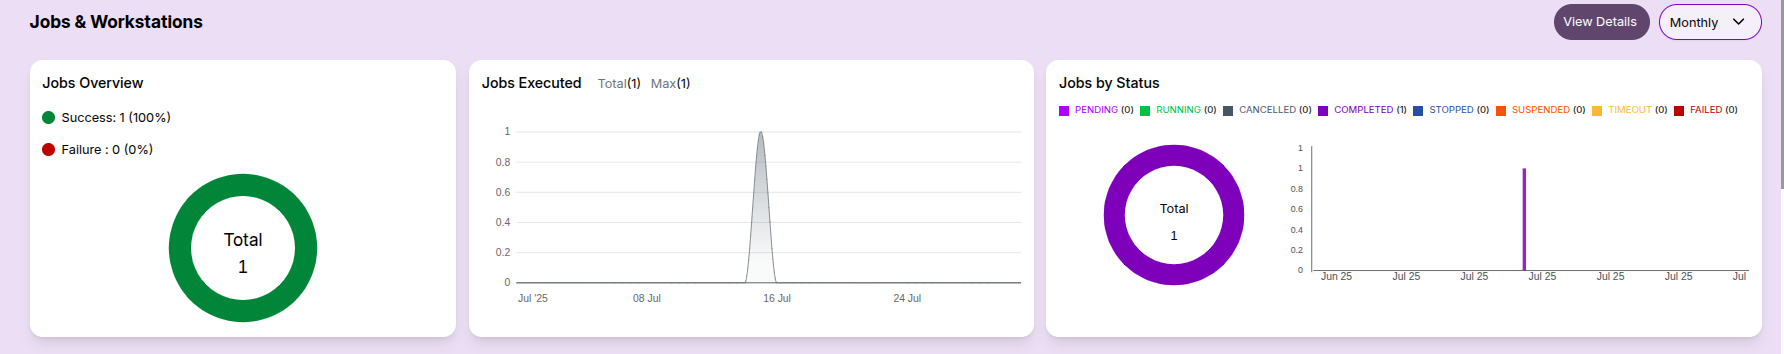
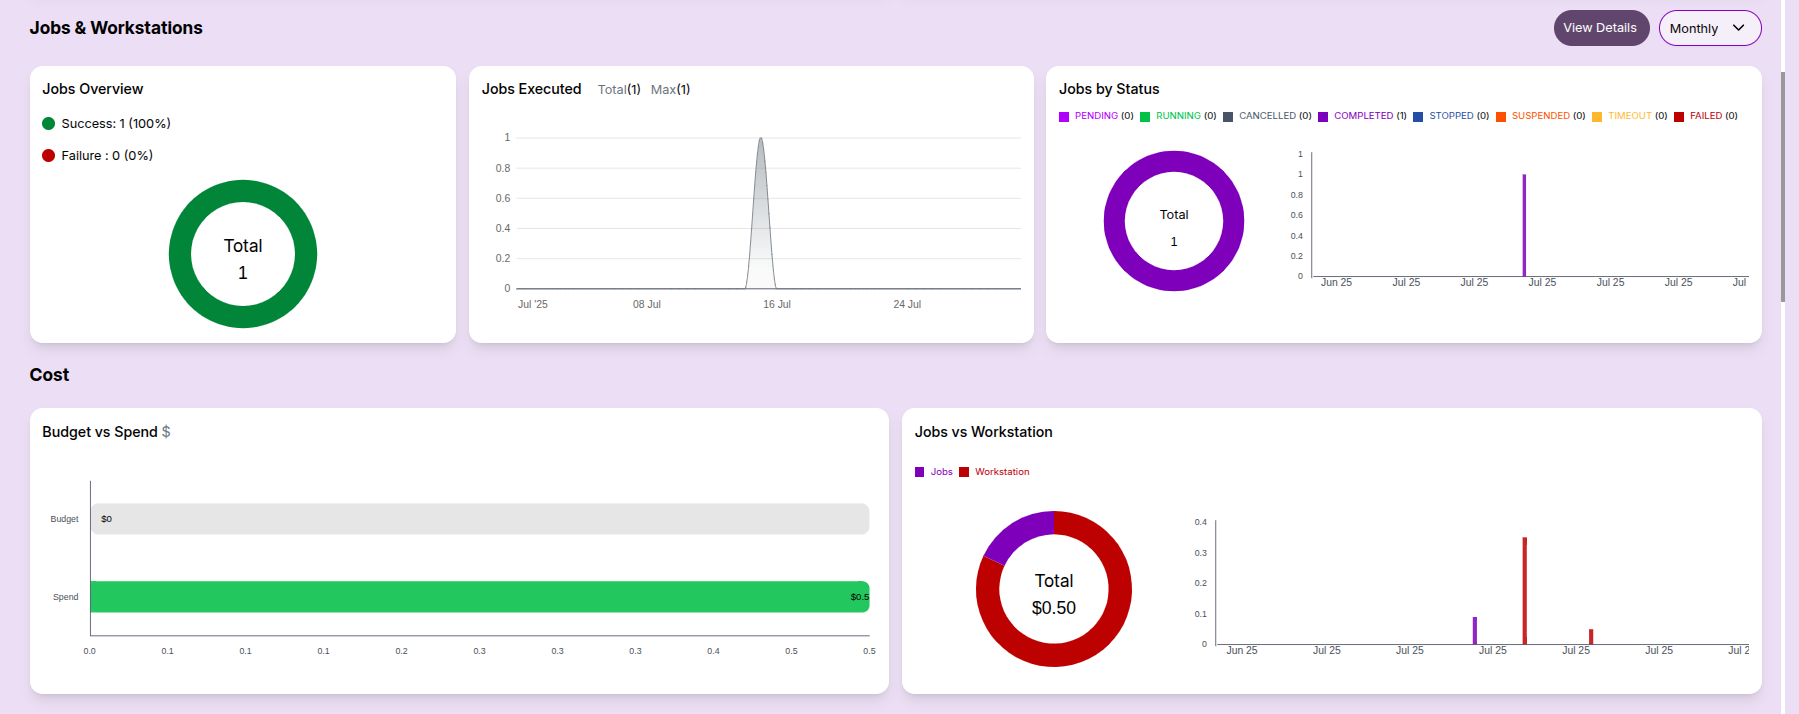
Jobs & Workstations Summary:
- Job status overview (success/failure)
- Execution trends and status distribution
Cost Overview:
- Budget vs Spend: This bar chart compares the allocated budget with the actual spend.
- Cost Breakup: Distribution of spend across jobs, workstations, and services.
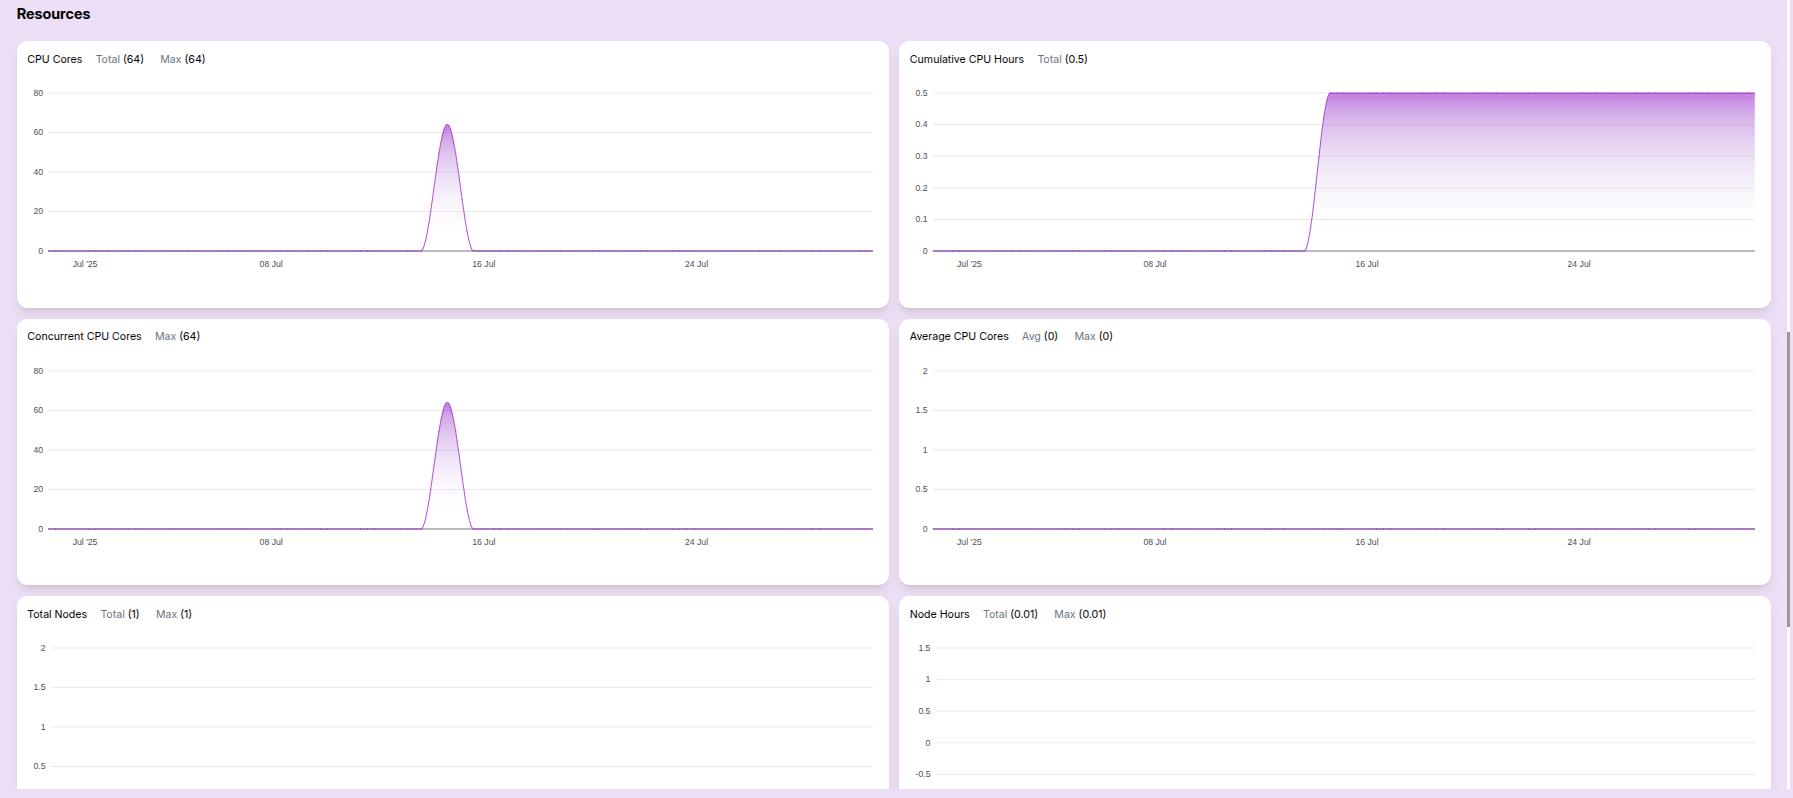
Resource Metrics:
- CPU cores usage: Helpful for tracking total capacity vs actual usage.
- Concurrent CPU cores: Useful for analyzing parallel job load.
- Cumulative CPU hours: Indicates total resource engagement.
- Average CPU usage: Shows average core usage over time.
- Total Nodes: Indicates the number of nodes provisioned.
- Node Hours: Highlights node utilization efficiency.
These metrics help users analyze both performance and cost at a glance.
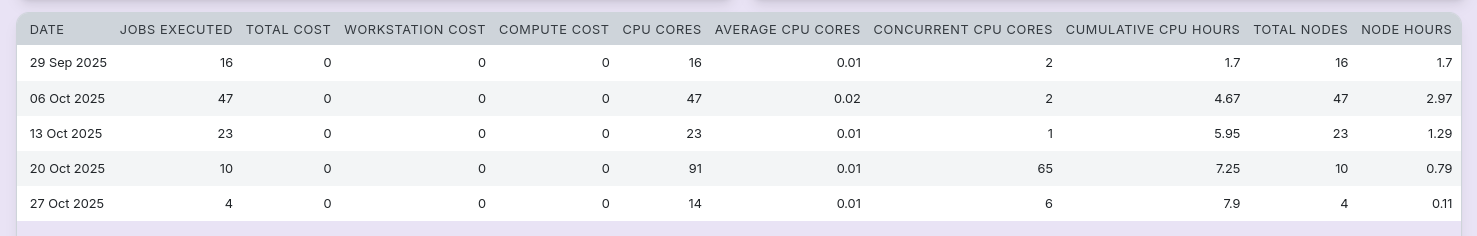
Computational Resource Report
This documentation provides a daily overview of job execution statistics, cost allocations, CPU metrics, and node utilization. It's designed to help teams monitor performance and optimize resource consumption.
Table View:
- Consolidated reports for the user are listed in this table, aggregated by monthly, daily, or weekly intervals.
This dashboard helps Projects monitor their resource consumption and job history across projects in a visual format.