Job Details
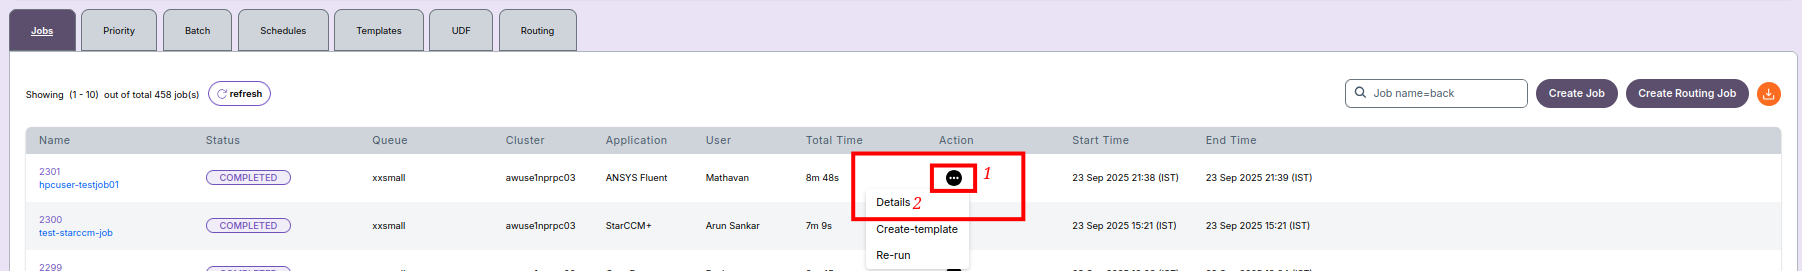
To view detailed job information:
- In the Job List, locate your submitted job.
- Click on the Action button (three dots menu).
- Select Details from the dropdown menu.
This will open the Job Details screen, which provides complete information about the selected job, including configuration, status, runtime metrics, logs, and results.
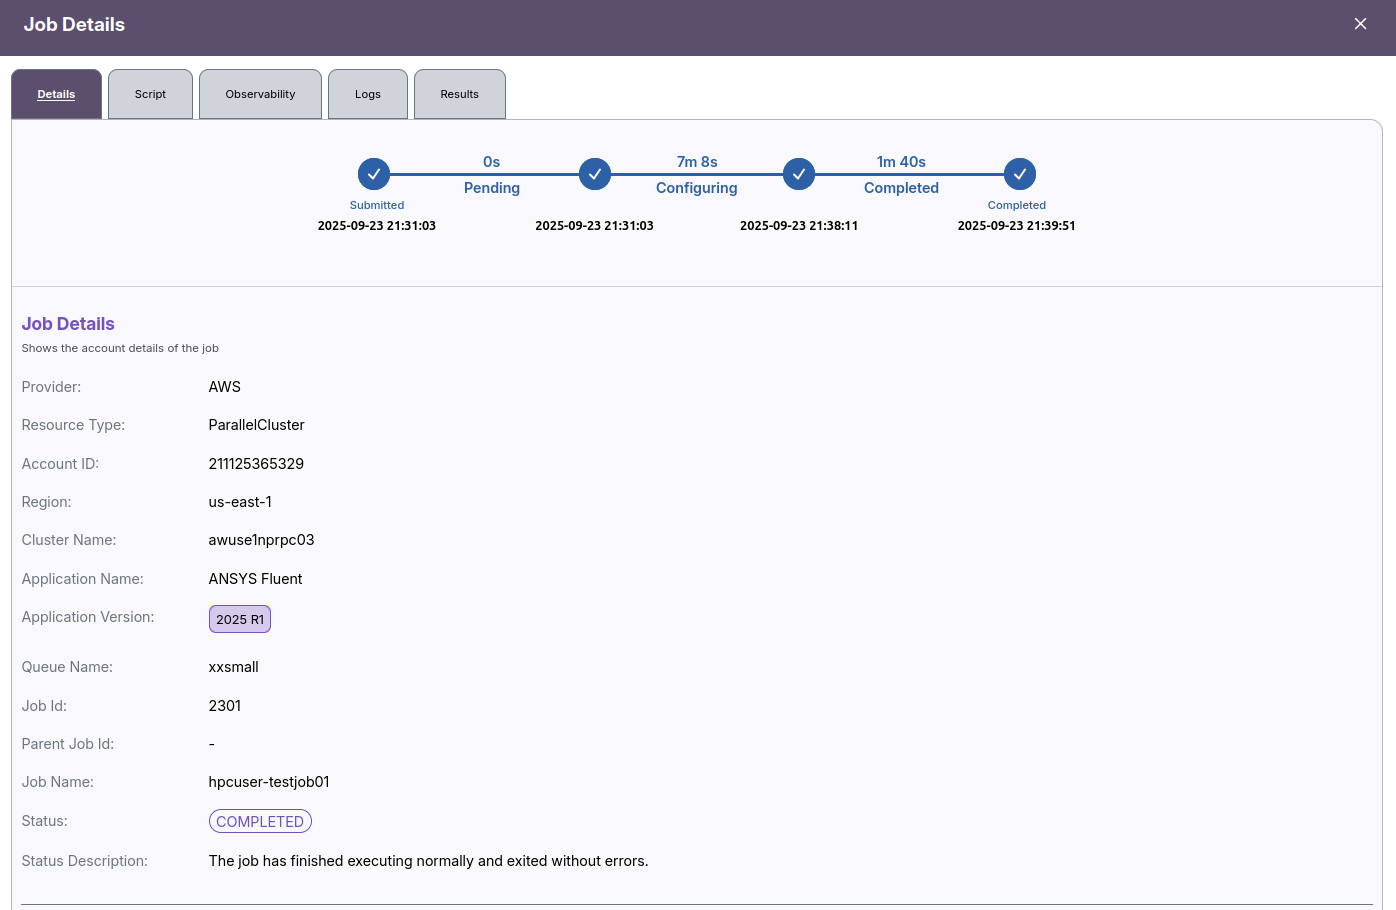
Job Details Screen
After clicking "Details", a comprehensive job information screen will open, showing key fields such as:
- Provider: Cloud or HPC provider.
- Resource Type: Type of allocated resources.
- Account ID: Billing or account identifier.
- Region: Cluster geographic location.
- Cluster Name: Name of the cluster in use.
- Application Name: Application run by job.
- Application Version: Version of the application.
- Queue Name: Scheduling queue used.
- Job Id: Unique job identifier.
- Job Name: User-assigned job name.
- Status Description: Textual status summary.
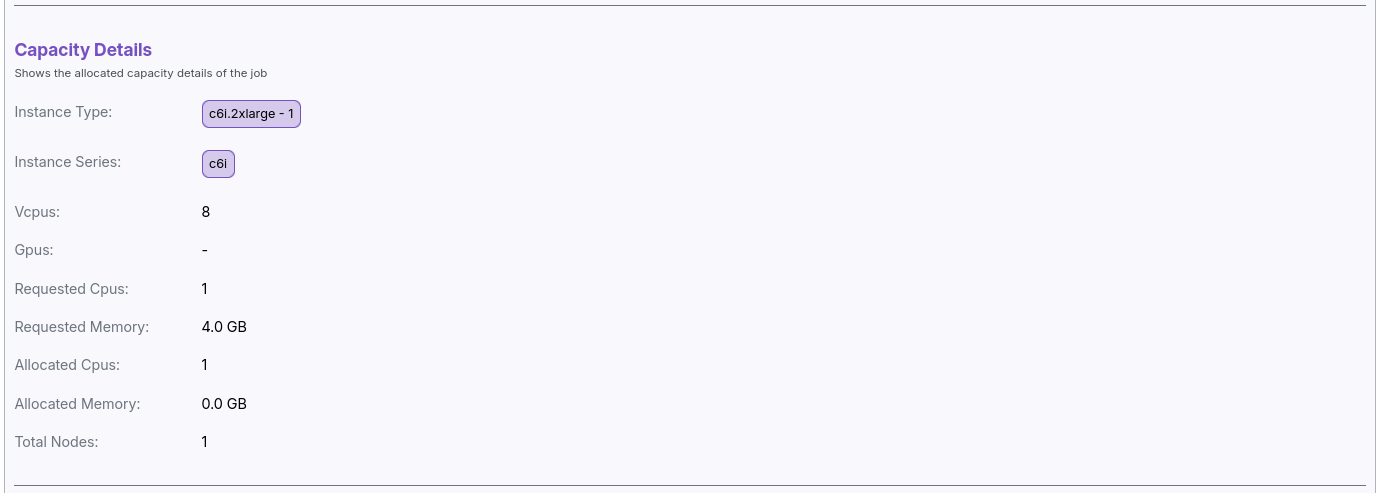
Capacity Details
The job details view also includes capacity details. it Shows the allocated capacity details of the job.
- Instance Type: Hardware instance type.
- Instance Series: Classification of instance type.
- vCPUs: Number of virtual CPUs assigned.
- GPUs: Number of GPUs assigned.
- Requested CPUs: CPUs requested by job.
- Requested Memory: Memory requested by job.
- Allocated CPUs: CPUs allocated to job.
- Allocated Memory: Memory allocated to job.
- Total Nodes: Number of allocated nodes.
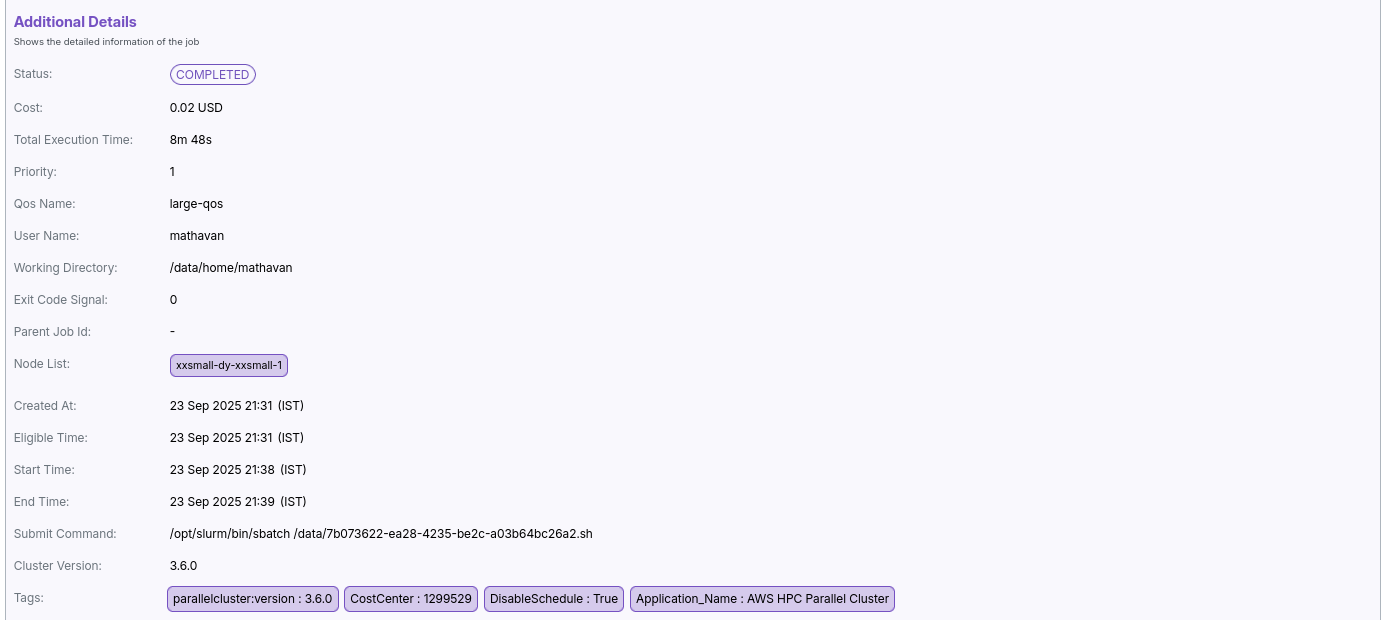
Additional Details
The job details view also includes additional details. it shows the detailed information of the job
- Status: Current state of the job (e.g., Completed, Running).
- Cost: Monetary cost of the job execution.
- Total Execution Time: Duration the job ran.
- Priority: Job processing priority level.
- QoS Name: Quality of Service assigned.
- User Name: User who submitted the job.
- Working Directory: Directory for job files and outputs.
- Exit Code Signal: Code indicating job exit status.
- Parent Job Id: ID of parent job if dependent.
- Node List: Compute nodes assigned.
- Created At: Job creation timestamp.
- Eligible Time: When job became eligible to run.
- Start Time: Actual job start time.
- End Time: Job completion time.
- Submit Command: Command/script used to launch job.
- Cluster Version: Cluster software version.
- Tags: Metadata about job attributes and environment. in addition with, it also show the job script.
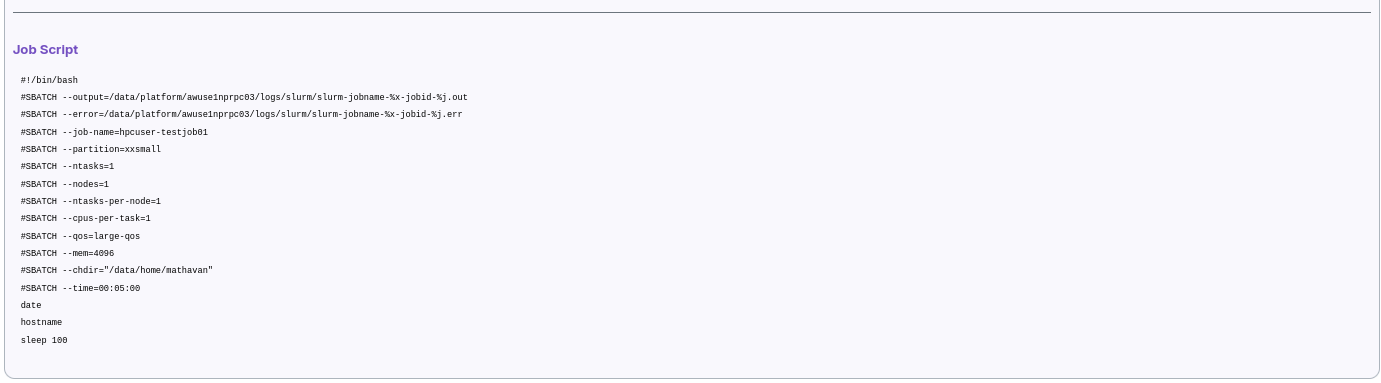
Job Script
At the bottom of the details screen, the actual batch/script submitted with your job is displayed, including directives and resource settings (e.g., SBATCH parameters).
-
📌 Notes
- Use the Details option to verify job configuration and execution status.
- For troubleshooting failed jobs, cross-check logs available in the details screen.
- Contact the Admin if critical information is missing or incorrect.
Job Script View
The Script tab in the Job Details screen displays the actual batch script that was submitted for job execution. This script includes all resource directives, environment setup, and custom commands provided at submission time.
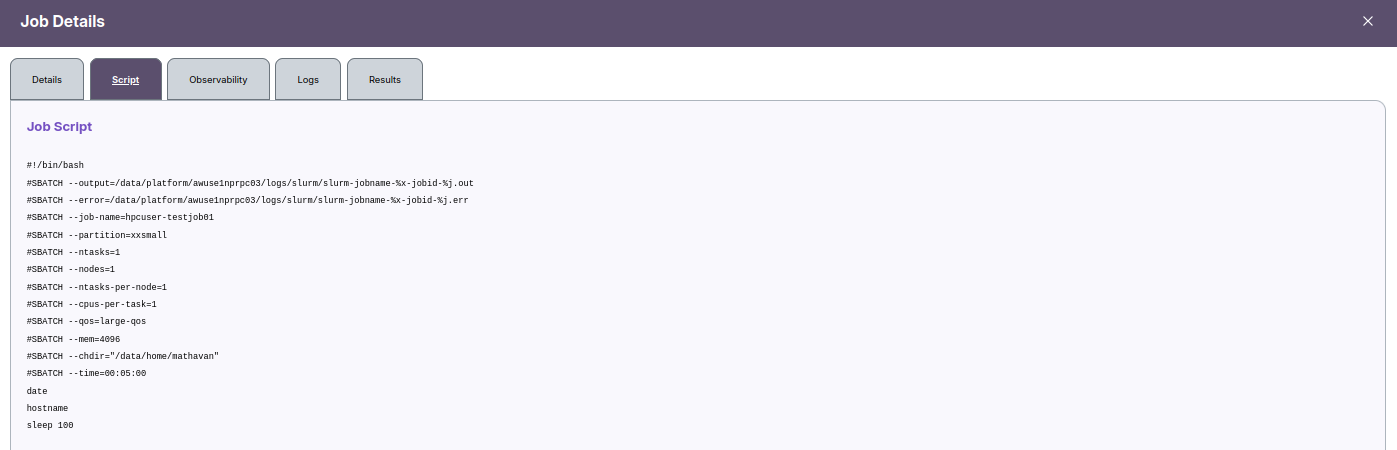
Key Points
- The script contains both SLURM
#SBATCHresource parameters and shell commands for execution. - Output and error log locations, job name, partition, node, memory, QoS, and run time are specified for reproducibility and troubleshooting.
- Custom commands such as
date,hostname, andsleep 100are executed as part of the job. - Always review the script tab for exact parameters and custom logic submitted with your job.
This section is essential for reproducing, debugging, or modifying jobs, as it reveals the complete set of instructions processed by the cluster during execution.
-
📌 Notes
- SLURM directives (
#SBATCH) control job resources, output, and scheduling. - Custom user commands follow the SLURM section and perform actual work.
- Reviewing the script helps with diagnosing issues and reproducing job runs.
Observability
The Observability tab in the Job Details screen provides real-time and historical monitoring of resource utilization for your job.
- The Efficiency panel at the top shows overall CPU Efficiency (%) and Memory Efficiency (%) for the job.
- For each node (e.g., Xxsmall-dy-xxsmall-1), detailed metrics are displayed.
- CPU Utilization graph depicts the percentage of CPU used over time, indicating how intensively your job consumed processor resources. Statistics such as minimum, average, and maximum CPU usage are shown above the graph.
- Memory Utilization graph illustrates memory usage over the job’s execution timeline with minimum, average, and maximum values provided.
- These graphs help identify bottlenecks, low resource utilization, or over-provisioning issues.
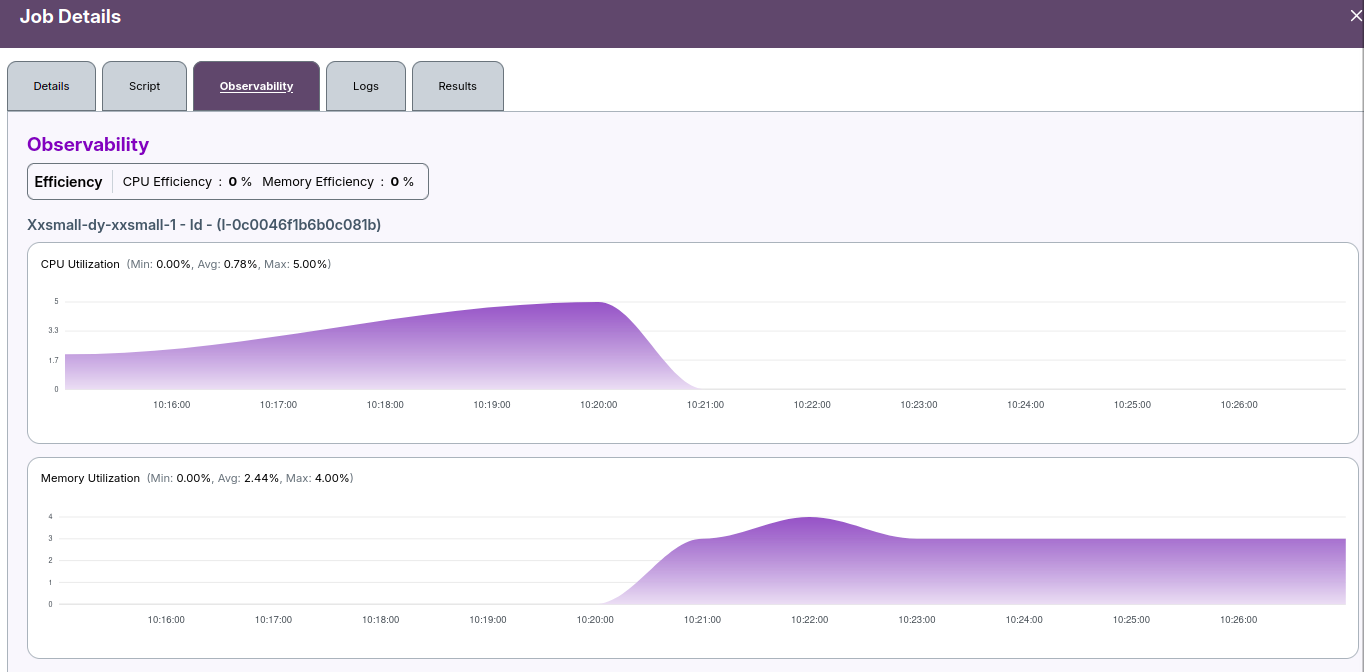
Use the observability data to optimize future job submissions by adjusting requested resources and configuration for better efficiency and cost savings.
Job Logs
The Logs tab in the Job Details screen provides detailed output and event history for the selected job.
- You can switch between different logs using the Job Output dropdown menu.
- Also dropdown cantain Job Error, Compute Node, Head Node .
- Log entries are displayed with timestamps, node details, and status messages.
- Use the Search box to quickly locate specific entries in the job logs.
- Navigation options allow loading older events or retrying if logs fail to load.
- The Downloads subsection (tab) provides access to downloadable log files if available.
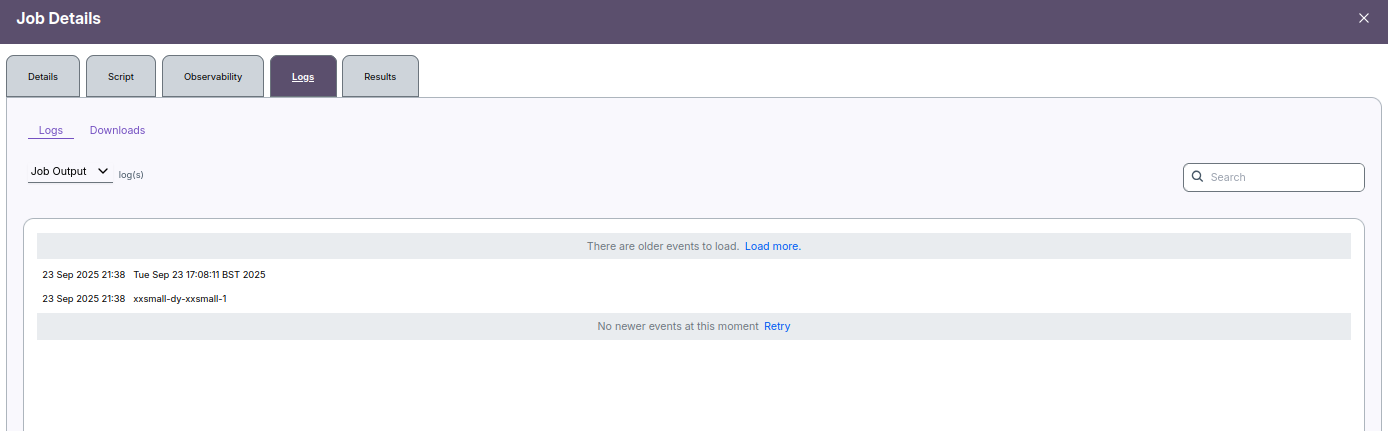
Reviewing logs is essential for diagnosing issues, monitoring job progress, and accessing output or error information.
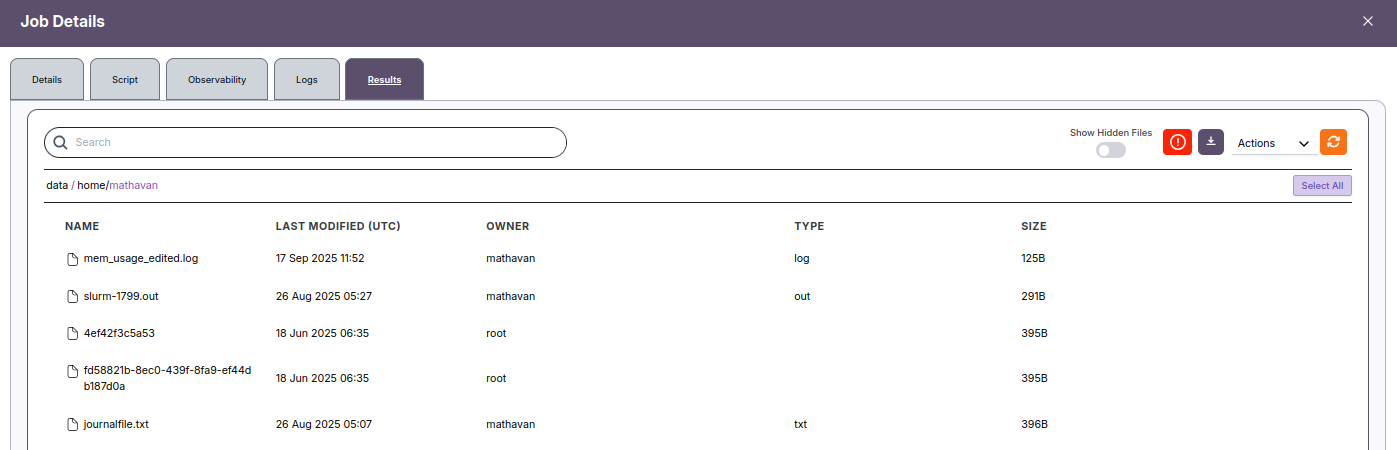
Job Results
The Results tab in the Job Details screen displays all output files generated by your job, making it easy to review, download, and manage outputs and logs.
- Results are shown in a table with columns for Name, Last Modified (UTC), Owner, Type, and Size.
- You can search for specific files using the search bar at the top.
- Toggle Show Hidden Files to include/exclude hidden files from the list.
- Use the Actions button to download and view selected files, or to perform other file management activities.
- Click Select All to select every file in the list for bulk actions.
- All job output files can be reviewed for correctness and troubleshooting.
- Download options make it simple to transfer key results to your local system.
- If expected files are missing, check job status or logs for completion issues.