Job Execution
This Job Execution Report helps track and analyze how jobs are executed across the HPC environment. It provides visibility into the number of jobs run, their execution statuses (completed, failed, cancelled, etc.), and the total execution time.
Each report focuses on a specific job-related metric such as highest number of jobs run, longest job duration, or most failed jobs, and can be filtered using parameters like provider, account, region, cluster, queue, and time duration.
Note:
- All reports listed Below follow the same functionality as HPC007 — they support filters, drilldown options, schedule creation, and export capabilities (Excel and PDF).
- For a step-by-step walkthrough, see the detailed explanation under HPC007, the same steps apply to all other reports.
HPC007 – Highest Job Runtimes
This report identifies the project, cluster, queue, user, or job with the longest execution durations within a selected time period.
Filters Available and Usage
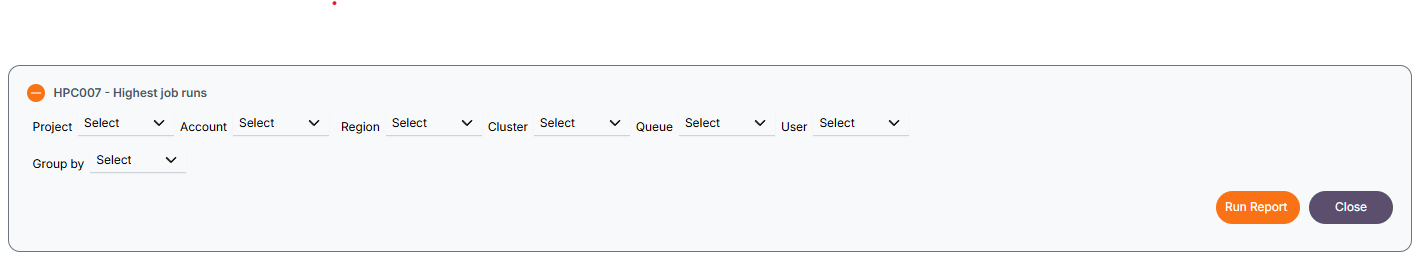 The following filters are available:
- Provider – e.g., AWS, Azure.
- Account – Cloud account to narrow scope.
- Region – Geographic data center region.
- Cluster – Compute cluster to analyze.
- Queue – Queue where jobs ran.
- User - User who ran the job.
- Group By – used to group data by project, cluster, queue or user.
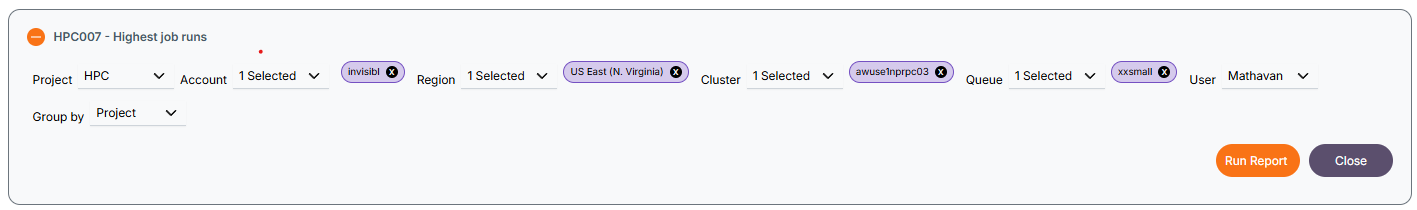
When one or more filters are selected, the report displays data accordingly based on the selected Project, Account, Region, Cluster, Queue, or User. Additionally, the Group by option organizes the results based on the chosen grouping criteria.
By clicking the Run Report button without selecting any filters, the report will be generated at the Project level. You can then drill down further into Cluster → Queue → User → Job by clicking on the respective project, cluster, queue or user.
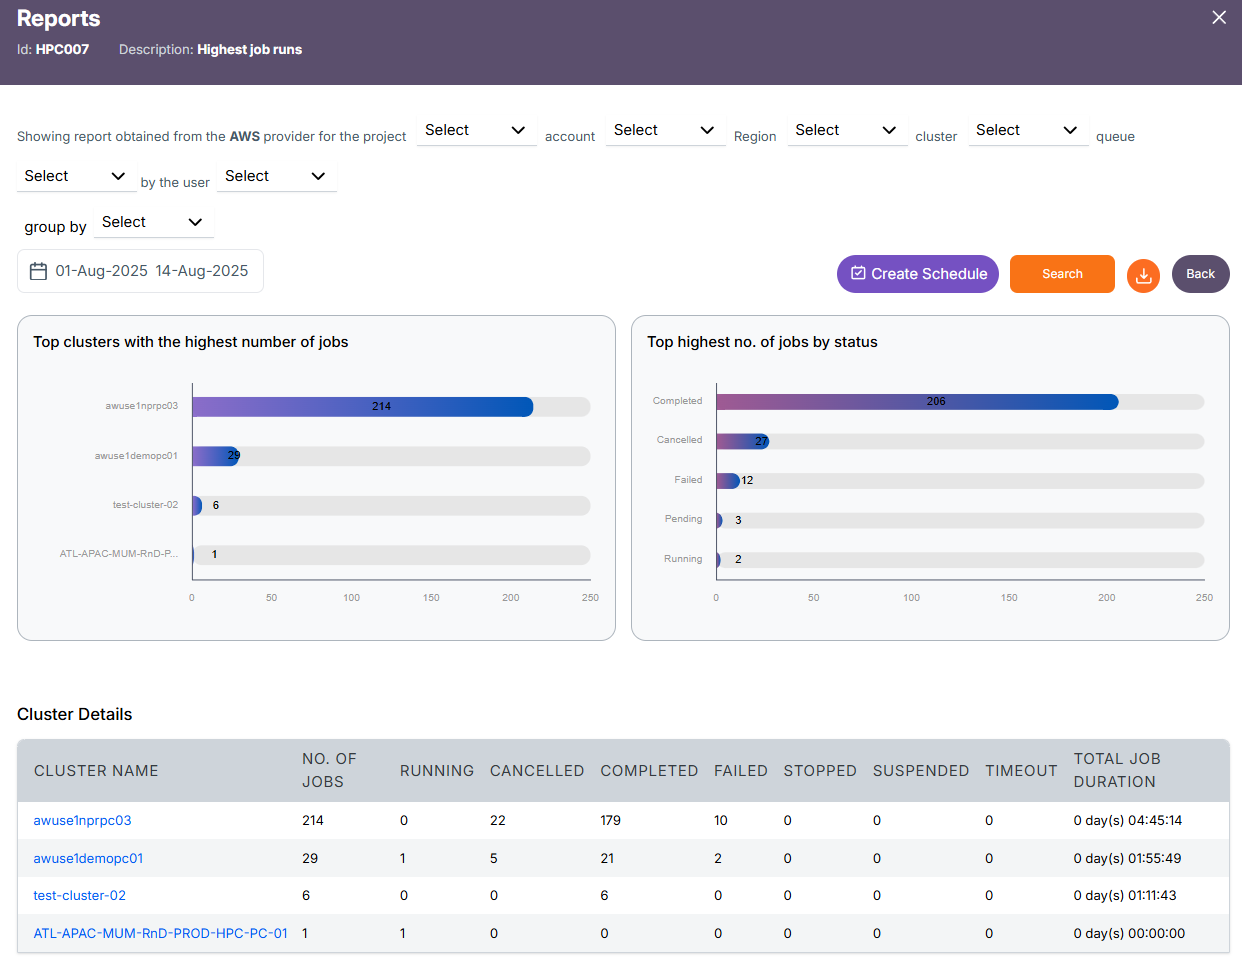
Project Level Report
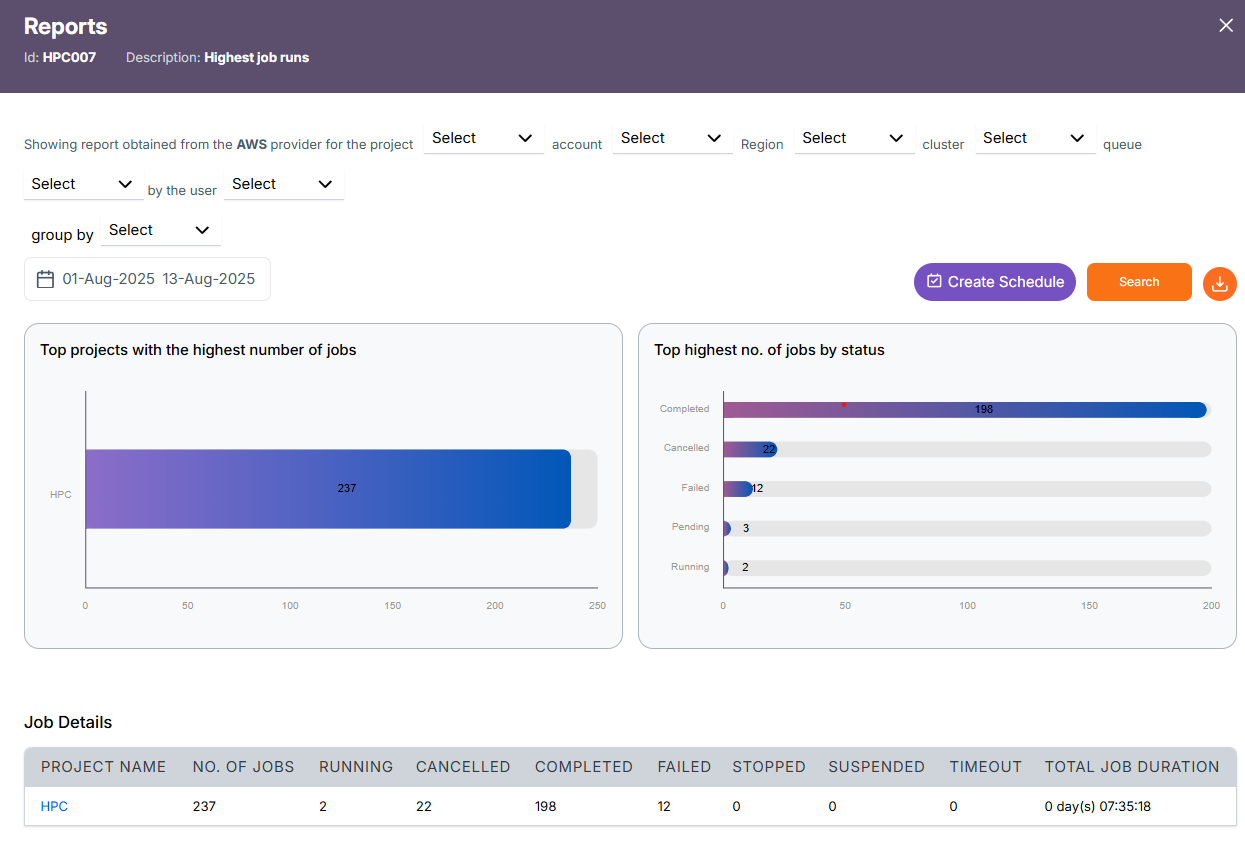
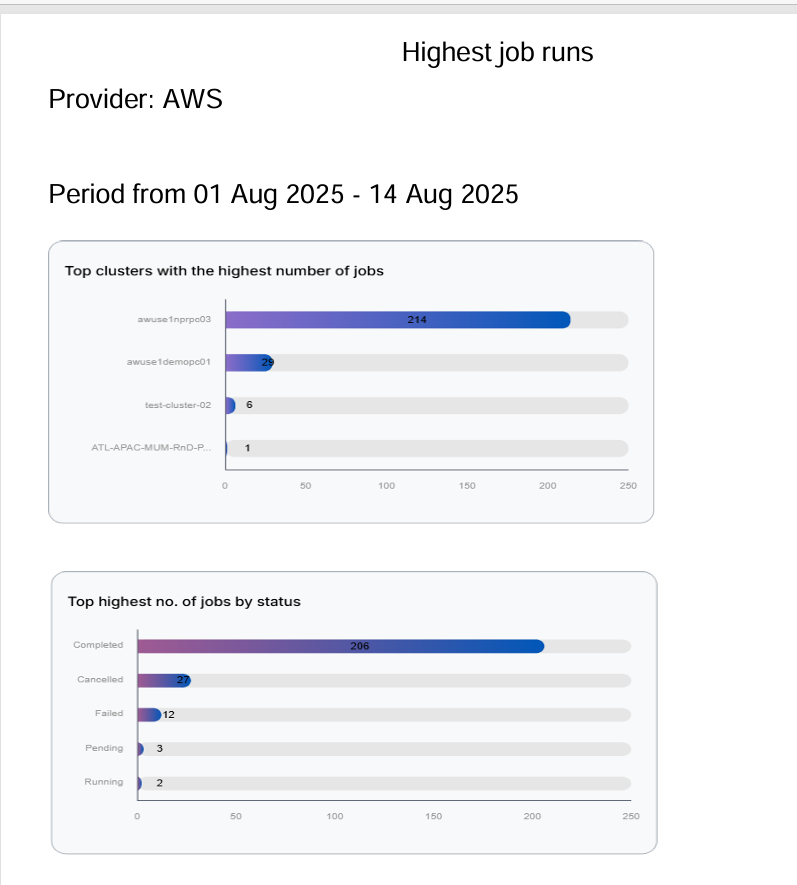
The horizontal stacked bar chart shows as follows:
-
Top projects with the highest number of jobs: Shows the total number of jobs executed by each project during the selected date range.
-
Top highest number of jobs by status: Breaks down the total jobs by their current status (Completed, Cancelled, Failed, Pending, Running), showing how many jobs fall into each category.
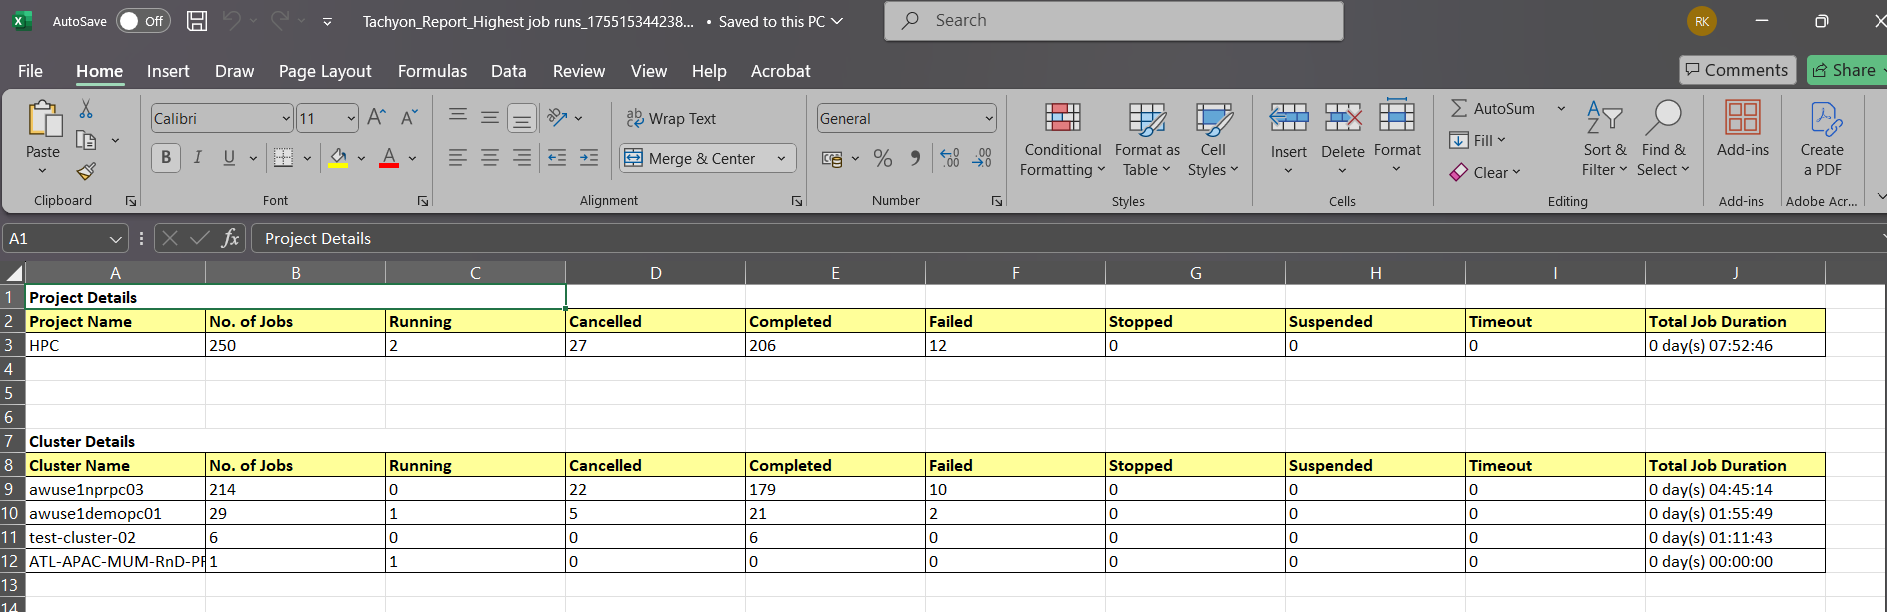
The Project detail contains:
- Project Name - The name of the HPC project. In this case, it's
HPC. - Number OF JOBS – Total number of jobs in the selected period.
- RUNNING – Number of jobs currently active.
- CANCELLED – Jobs that were stopped before completion.
- COMPLETED – Jobs successfully completed.
- FAILED – Jobs that ended due to errors.
- STOPPED – Jobs forcefully stopped.
- SUSPENDED – Jobs paused or suspended.
- TIMEOUT – Jobs stopped because they exceeded the allowed time limit.
- TOTAL JOB DURATION - The cumulative duration of all jobs (completed + failed + others), shown as
days hh:mm:ss.
Likewise for the Cluster, Queue, User and job are as follows
Cluster Level Report
Project(Eg.HPC) -> Cluster Details(respective cluster(s) for the selected project)
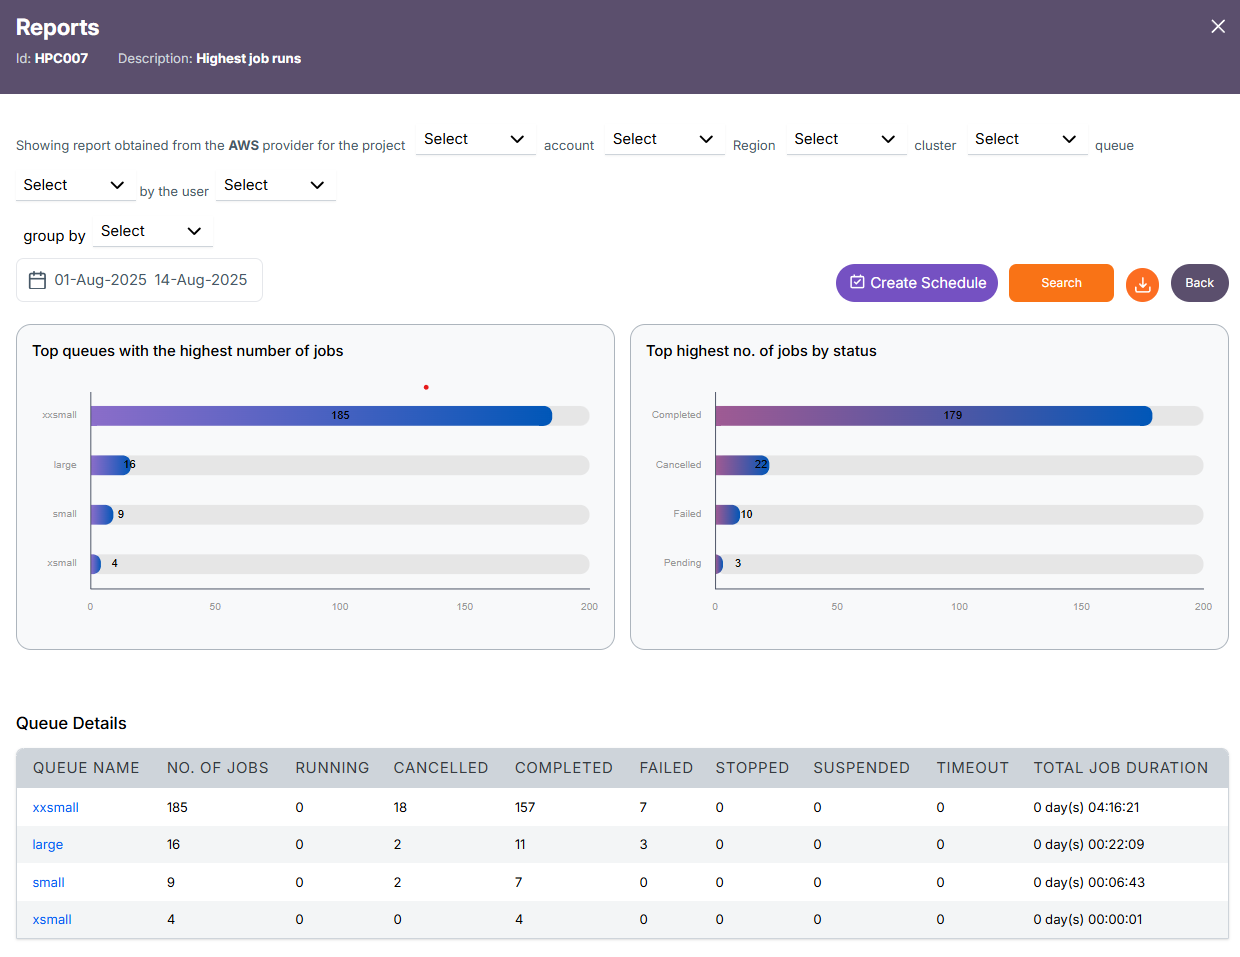
Queue Level Report
Cluster -> Queue Details(respective queue(s) for the selected cluster)
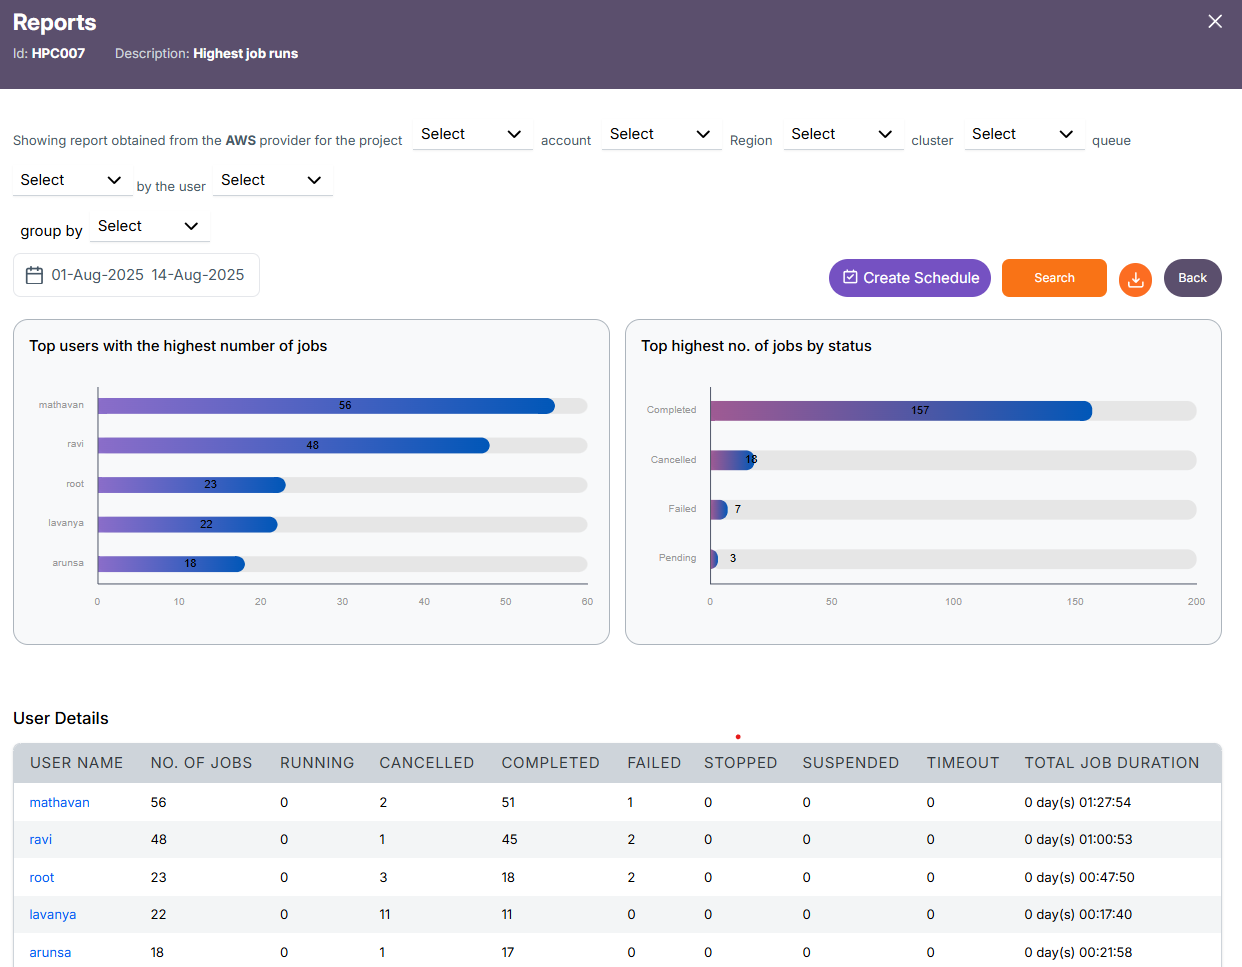
User Level Report
Queue -> User Details(respective user(s) for the selected queue)
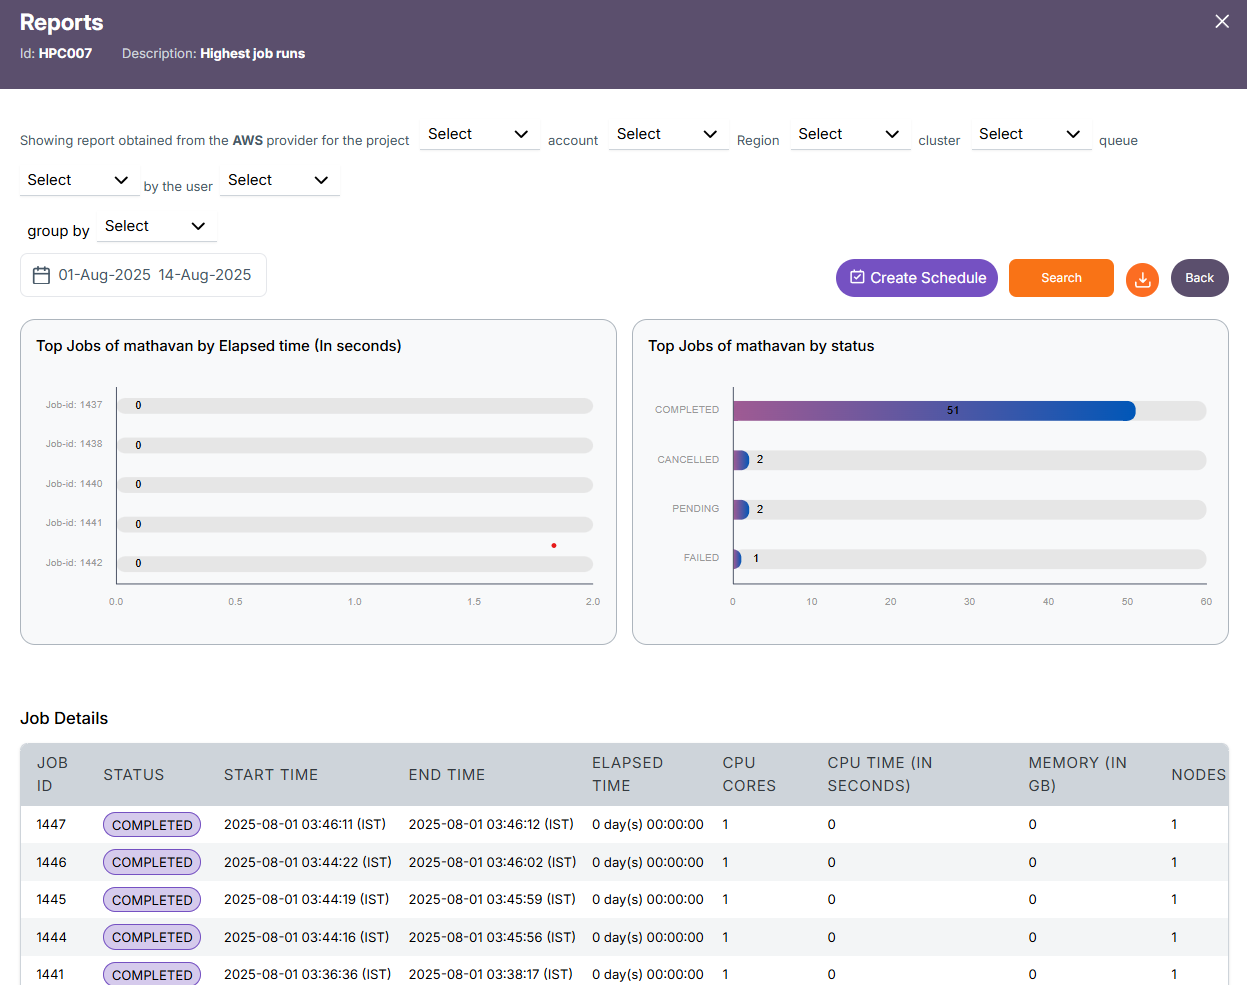
Job Level Report
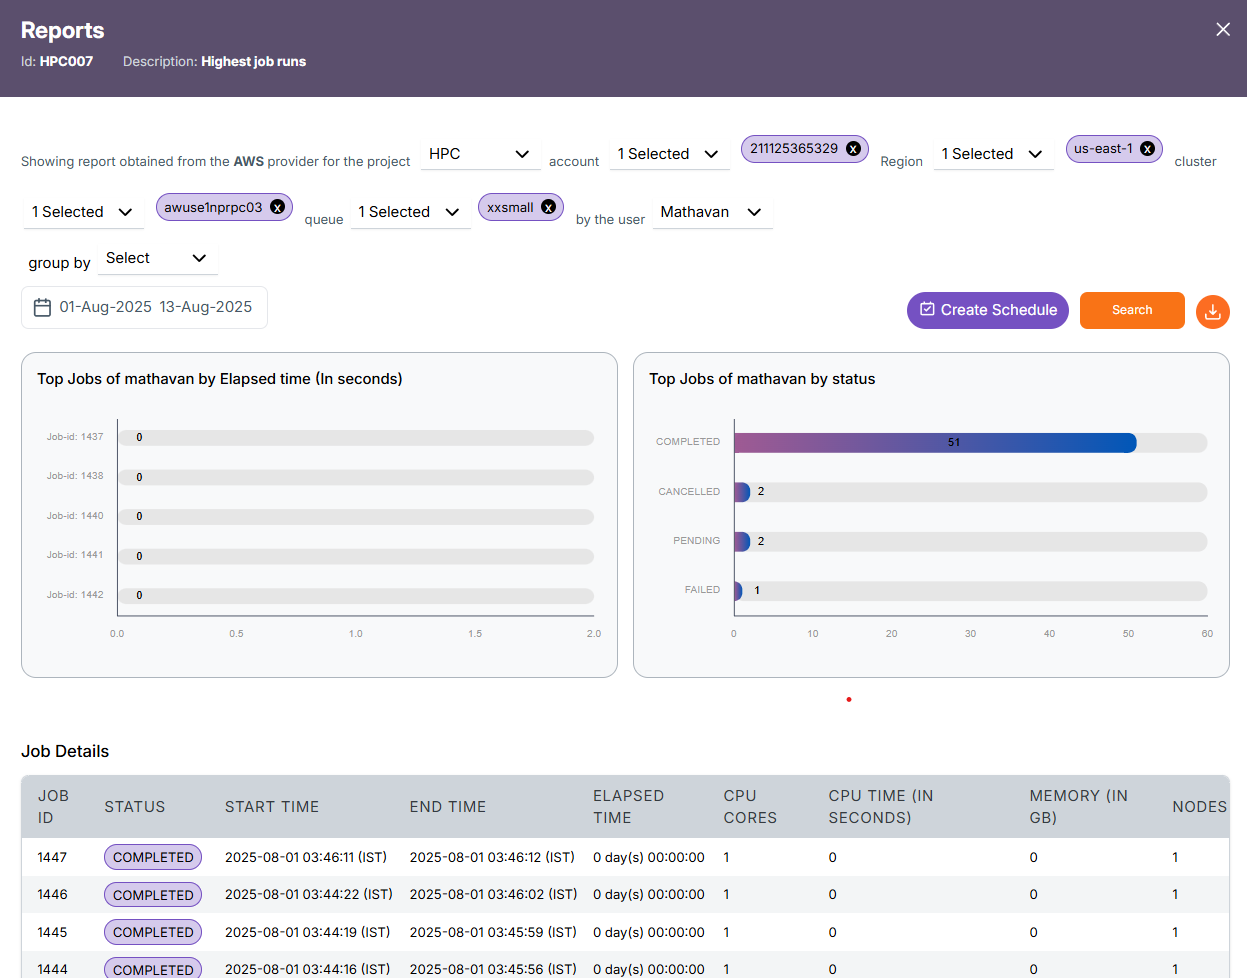
User -> Job Details(Selected Users Job details)
Schedule Creation
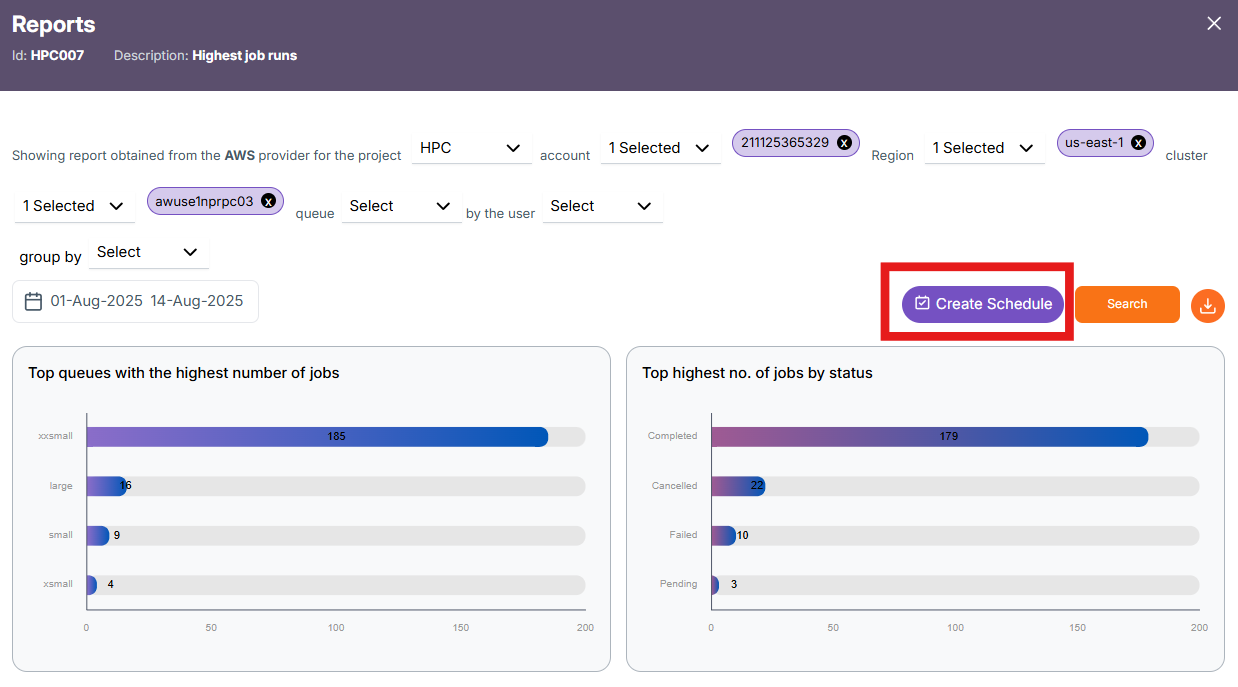
The Create Schedule feature allows you to automate report generation. Instead of manually selecting filters and running reports each time, you can schedule the report to run at regular intervals (e.g., daily, weekly) and have it emailed or stored for easy access.
-
Click on the Create Schedule button located near the top-right, beside the Search button.
-
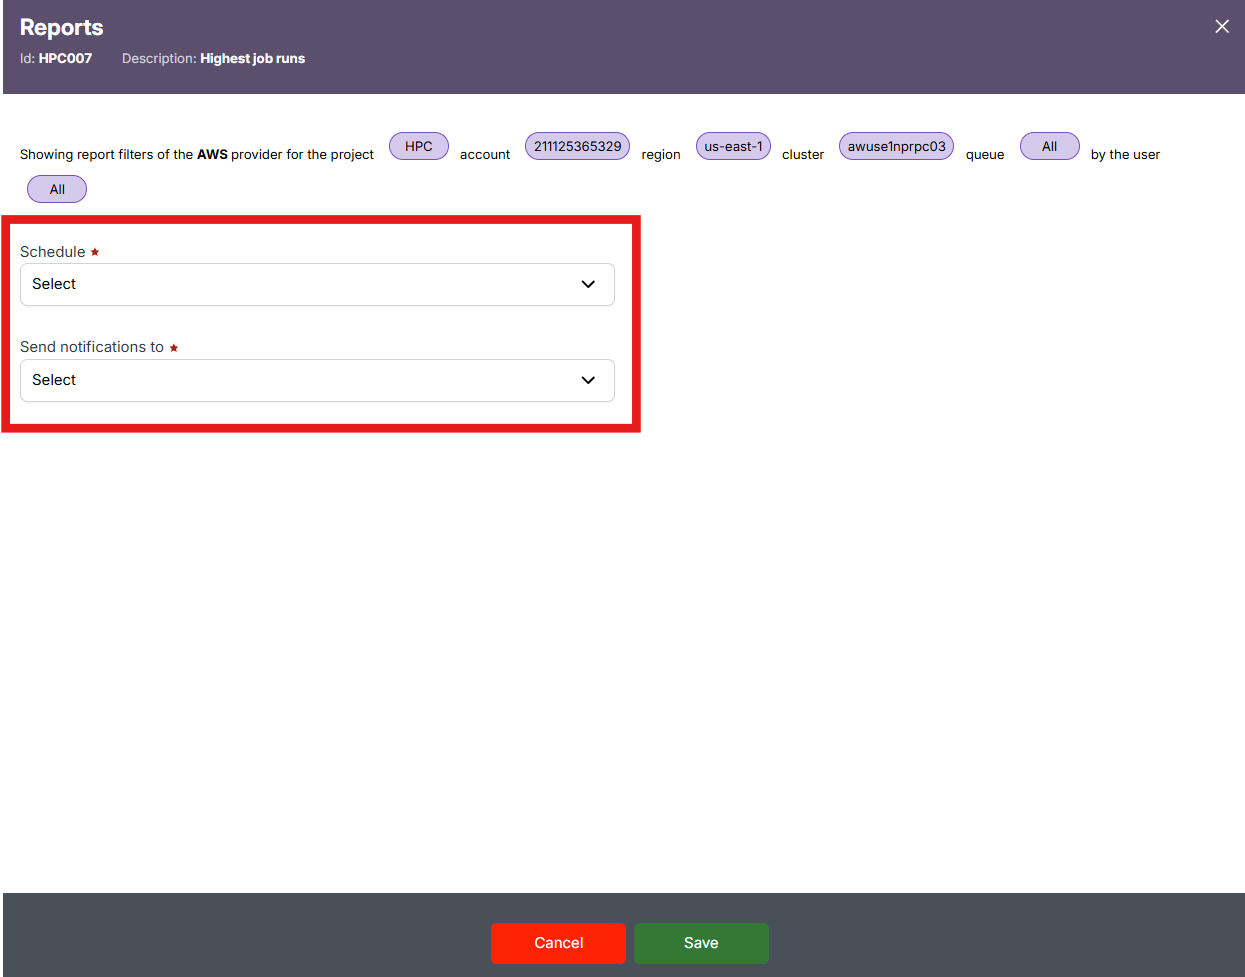
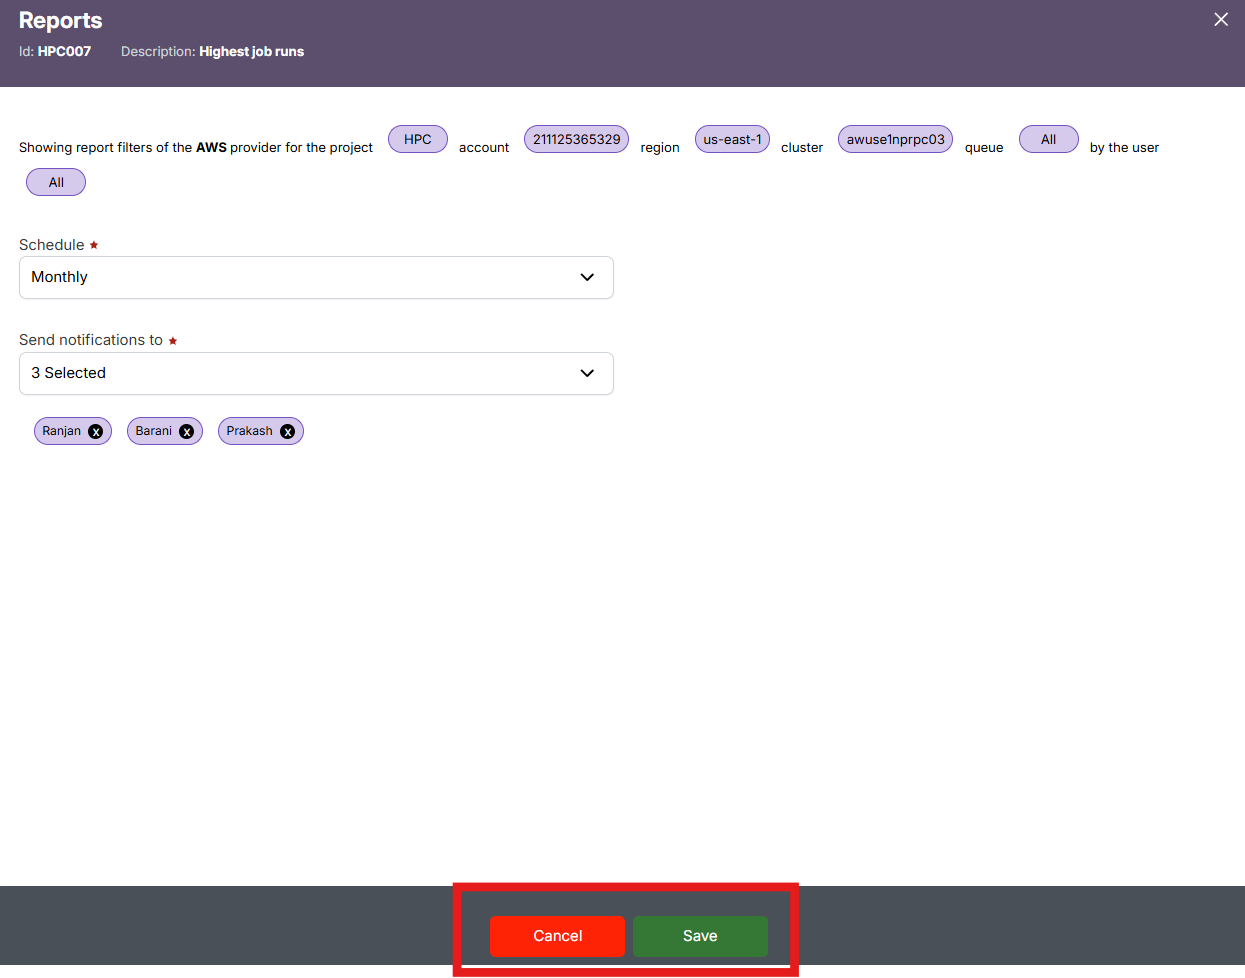
In the "Schedule" dropdown, select a schedule frequency (e.g., Daily, Weekly) and in the "Send notifications to" dropdown, choose the user(s) who should receive alerts when the report is generated.
-
Review the applied filters displayed at the top (like Provider, Project, Account, Region, Cluster, Queue, and User) – these will be locked to the schedule.
-
Click "Save" to finalize the schedule or "Cancel" to discard the setup.
-
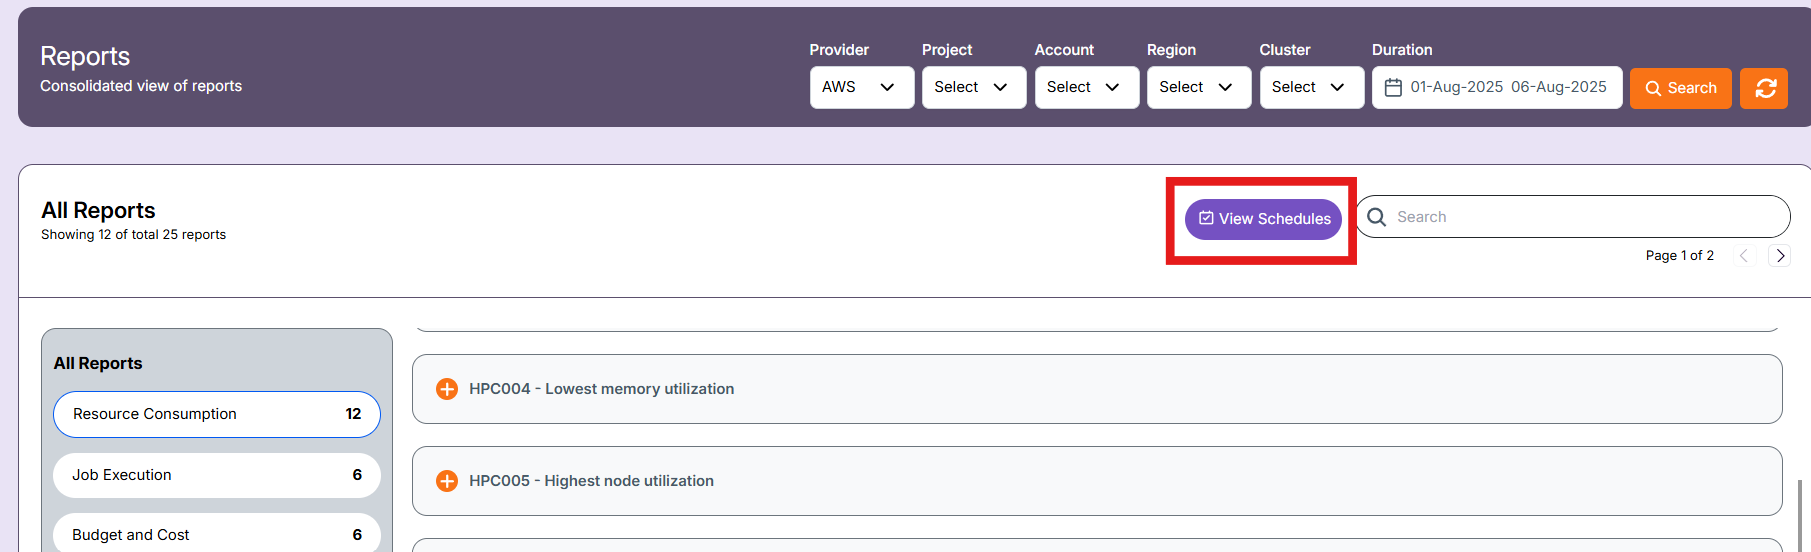
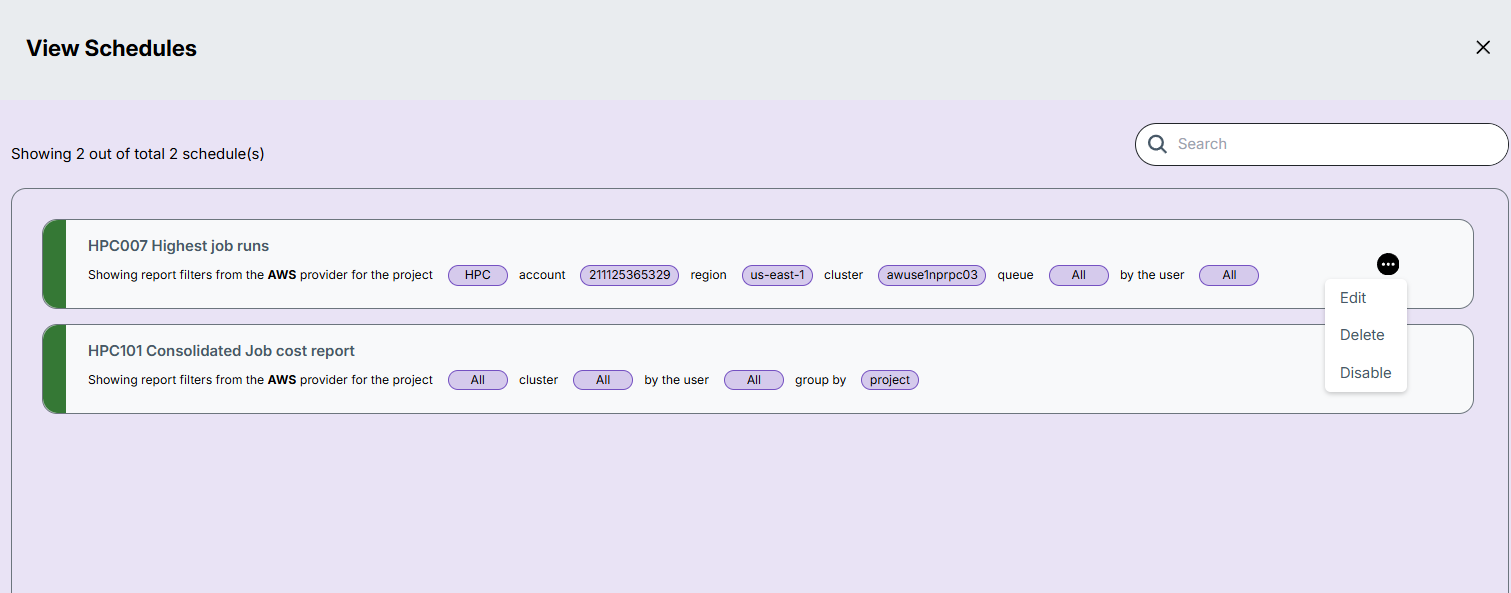
After saving the schedule, you can view them in the "view schedule" in landing page of report section.
-
There are three actions that can be performed on a schedule:
- Edit – Update schedule settings such as filters, time, or recipients.
- Delete – Remove the schedule permanently.
- Enable/Disable – Temporarily activate or deactivate the schedule without deleting it.
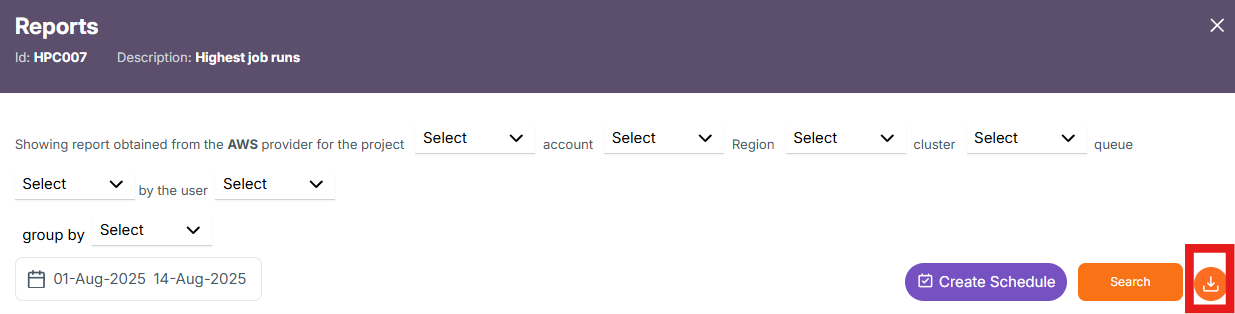
Export Report
The Download button at the top right corner allows you to export the report data in two formats:
-
Excel (.xlsx): Contains the tabular report data based on selected filters.
-
PDF (.pdf): Contains the graph/chart data shown in the visual section of the report.
When you click the Download icon, a Drilldown Downloads window appears, allowing you to choose the level of data you want to export.
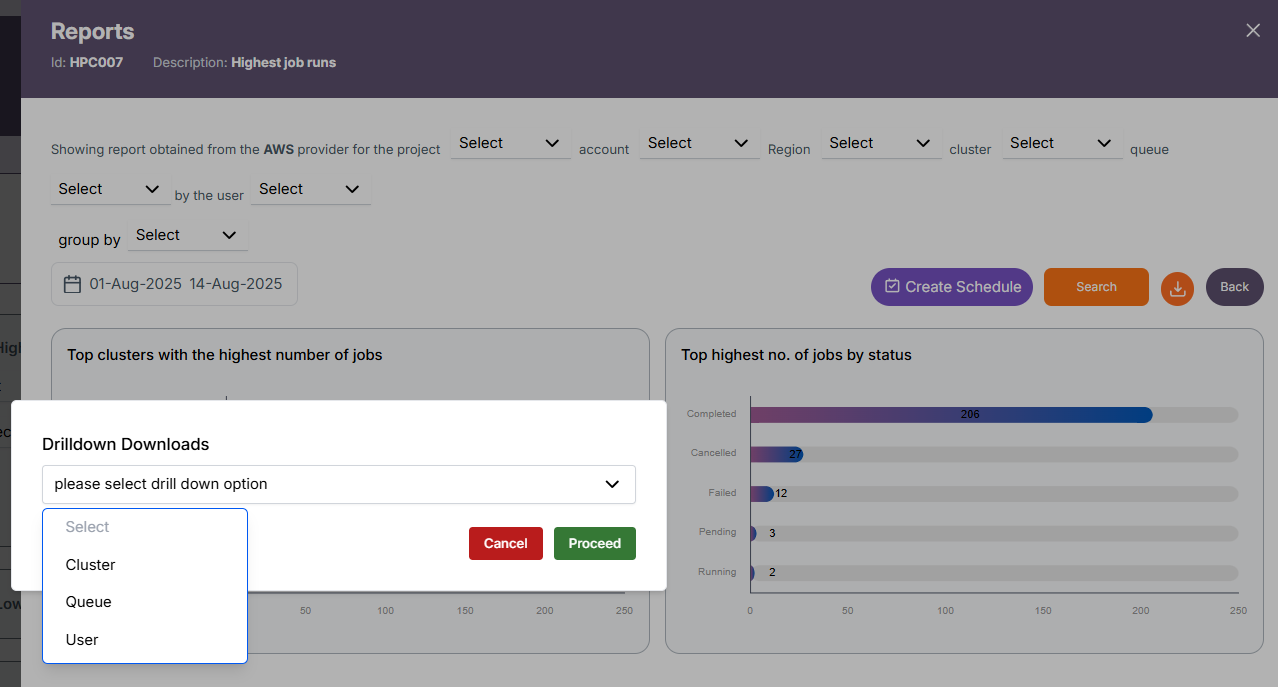
You can select from the following drilldown options:
- Project
- Cluster
- Queue
- User
This feature enables exporting both the current grouped level data and its child-level breakdown, providing a more detailed and contextual report.
-
Example: If you are on the Project level and choose to download User-level data, the Excel file will include both the Project data and the User data for that project in separate tables.
-
Direct Export: If you are at the Project or Job level, the child-level dropdown will not appear — the download will directly export the data for the current level
Export Formats: Excel and PDF
Excel
HPC008 – Lowest Job Runs
-
Identifies projects, clusters, queues, users, or jobs with the fewest executed jobs in the selected time period.
-
Useful for spotting under-utilized resources or low-activity workloads.
HPC009 – Highest Job Run Times
-
Lists jobs or entities with the longest execution durations during the selected time frame.
-
Helps in detecting potential performance bottlenecks or unusually long-running tasks.
HPC010 – Lowest Job Run Times
-
Shows jobs with the shortest execution durations within the chosen period.
-
Can reveal inefficient submissions or jobs terminating quickly due to configuration errors.
HPC012 – Failed Jobs
-
Displays the count of jobs that did not complete successfully across all levels(i.e project, cluster, queue, user or job).
-
Enables quick identification of failure trends across clusters, queues, or users.
HPC013 – Reason for Failed Job
- Identifies jobs that underused node allocations or requested excessive node counts unnecessarily.