📊 Dashboard — Cluster View
The Cluster Dashboard provides a consolidated overview of HPC cluster resource consumption.
It helps administrators and users monitor compute utilization, track cost efficiency, and understand performance trends across time.
🧭 Overview
When Type = Cluster is selected from the dashboard filters, the page displays all available clusters with summarized metrics.
You can further refine the results using filters such as Provider, Account, Region, and Duration to view usage data for specific environments.
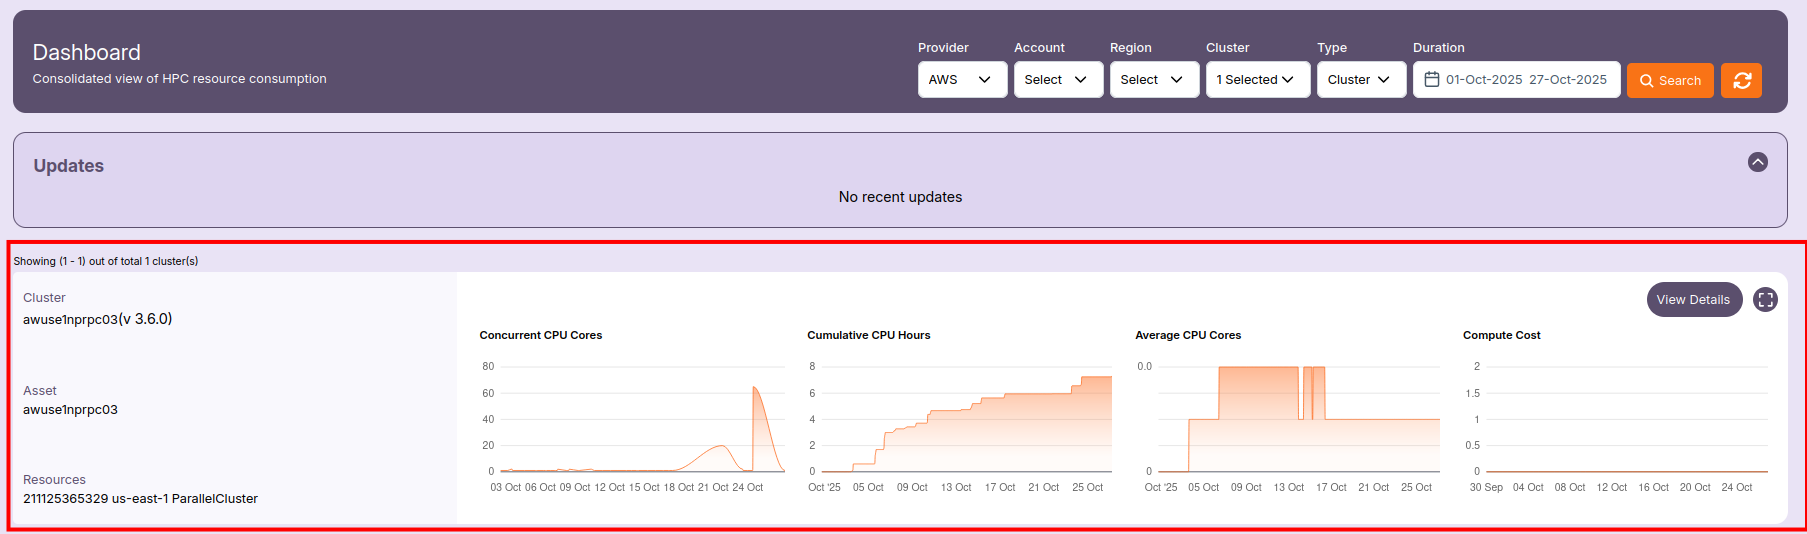
📋 Cluster Summary
Each cluster card shows basic details for quick reference:
- Cluster Name — The name of the HPC cluster (e.g.,
awuse1nprpc03). - Version — The ParallelCluster version (e.g.,
v3.6.0). - Asset ID — Internal reference name of the cluster.
- Resources — Includes the AWS account ID, region, and cluster type (e.g.,
211125365329 us-east-1 ParallelCluster).
Use this summary to identify which cluster the displayed metrics belong to.
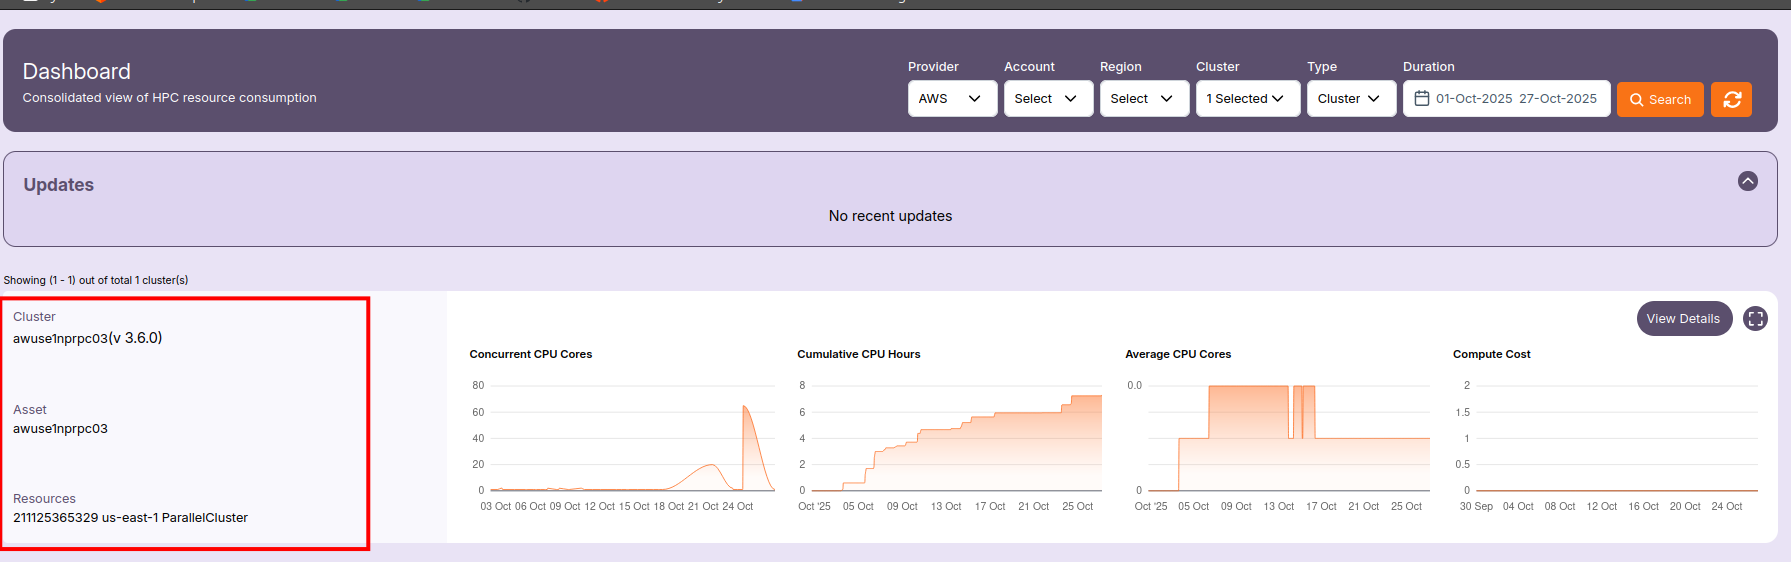
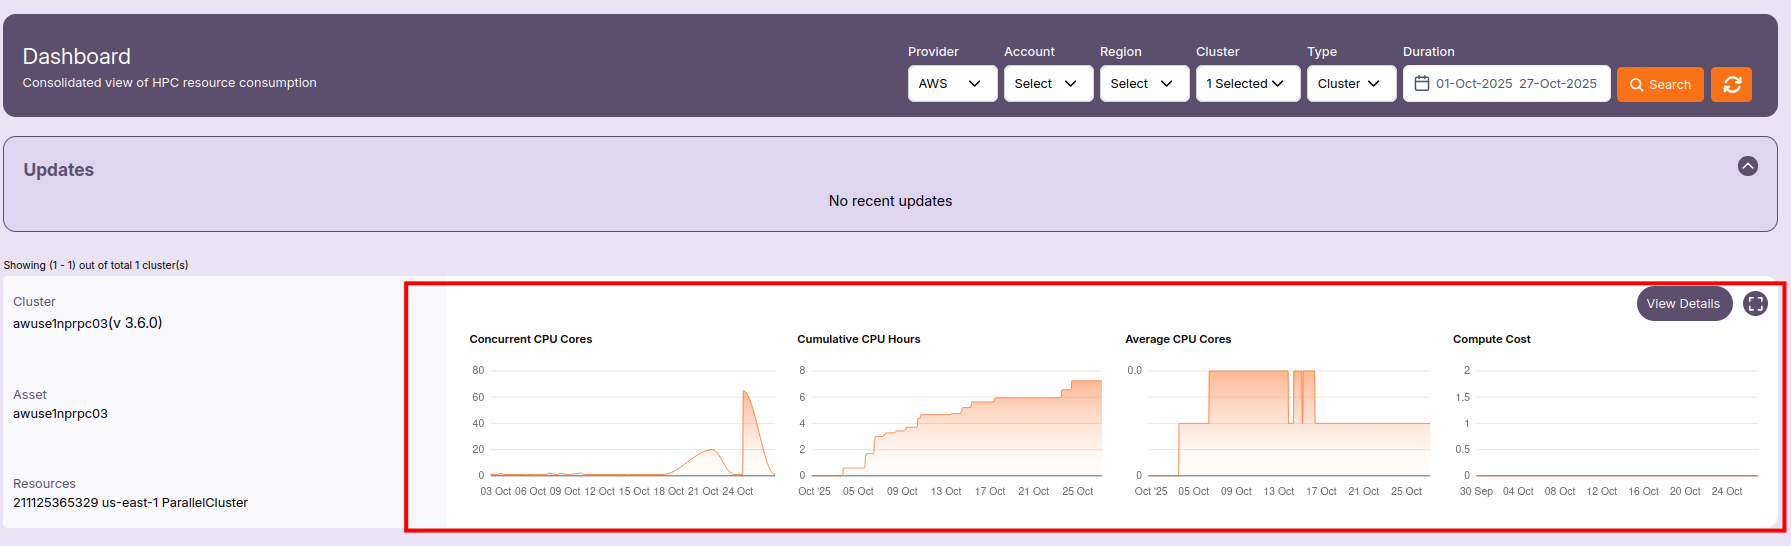
📈 Metrics and Graphs
Each cluster includes time-based metric graphs that visualize utilization and cost patterns:
🧮 Concurrent CPU Cores
Shows the total number of CPU cores running simultaneously within the selected duration.
A higher value indicates active compute jobs or scaling events.
⏱️ Cumulative CPU Hours
Displays the cumulative number of CPU hours consumed by the cluster over time.
This helps estimate resource usage and efficiency.
⚙️ Average CPU Cores
Represents the average number of CPU cores in use during the selected time window.
It provides insight into how effectively the cluster resources were utilized.
💰 Compute Cost
Tracks the estimated compute cost associated with the selected cluster and duration.
Use this to monitor budget utilization and identify high-cost periods.
🕓 Updates Section
The Updates panel displays any recent configuration changes, scaling events, or system updates related to the clusters.
If no changes have occurred recently, it shows “No recent updates.”
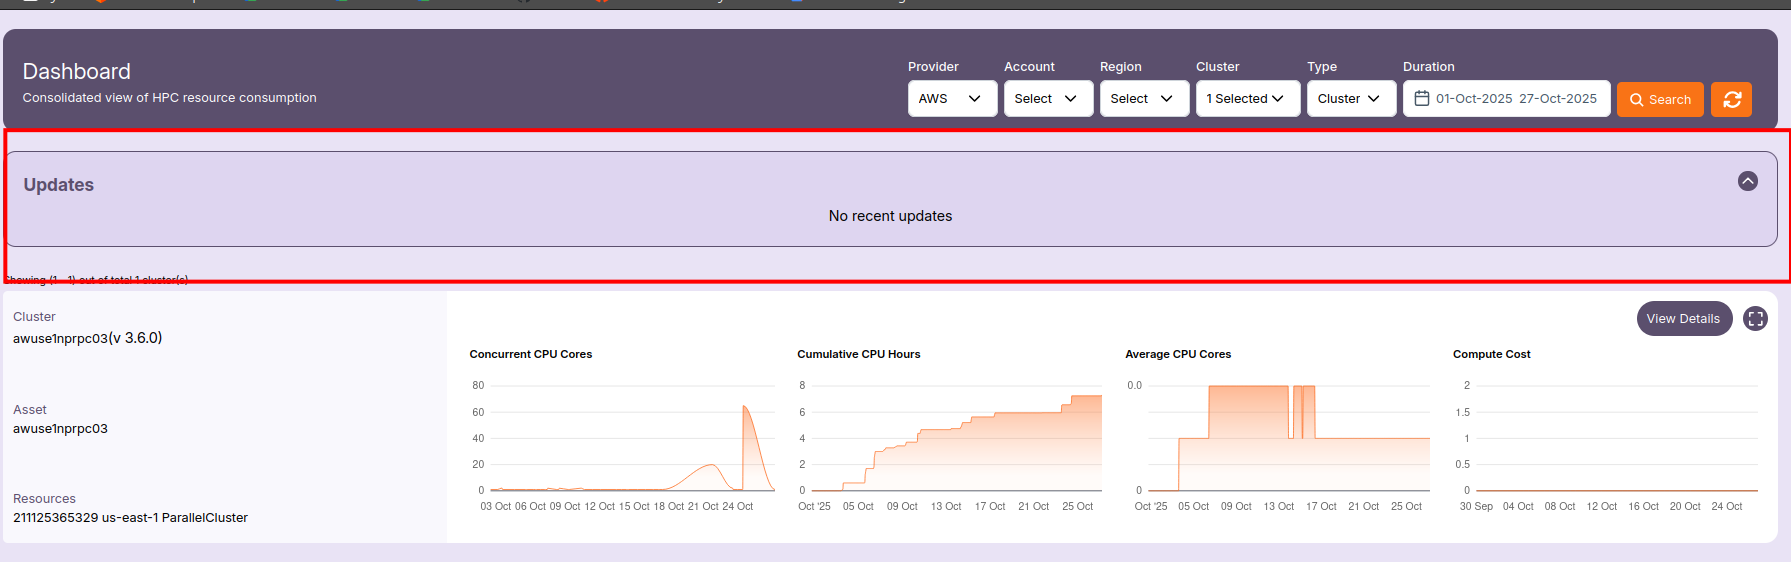
- Use the Search and Refreshbuttons to retrieve the latest metrics or to modify filter combinations without reloading the page.
🔎 View Cluster Details
When you click “View Details”, a popup opens to show an expanded, in-depth summary of the selected cluster.
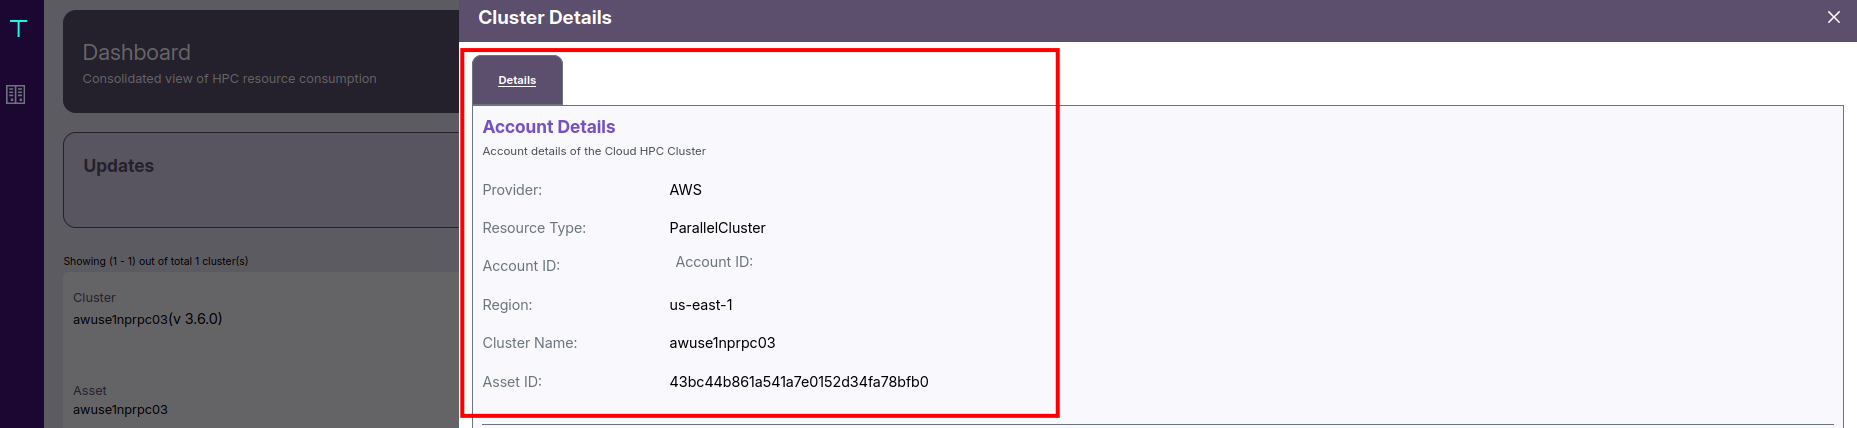
📘 Cluster Details Overview
This section gives you the cluster’s account-level information — including its provider, region, and associated asset identifiers.
- For example, it may show that the provider is AWS, with a ParallelCluster resource type in the us-east-1 region.
- The Cluster Name (like
awuse1nprpc03) and Asset ID uniquely identify the resource.
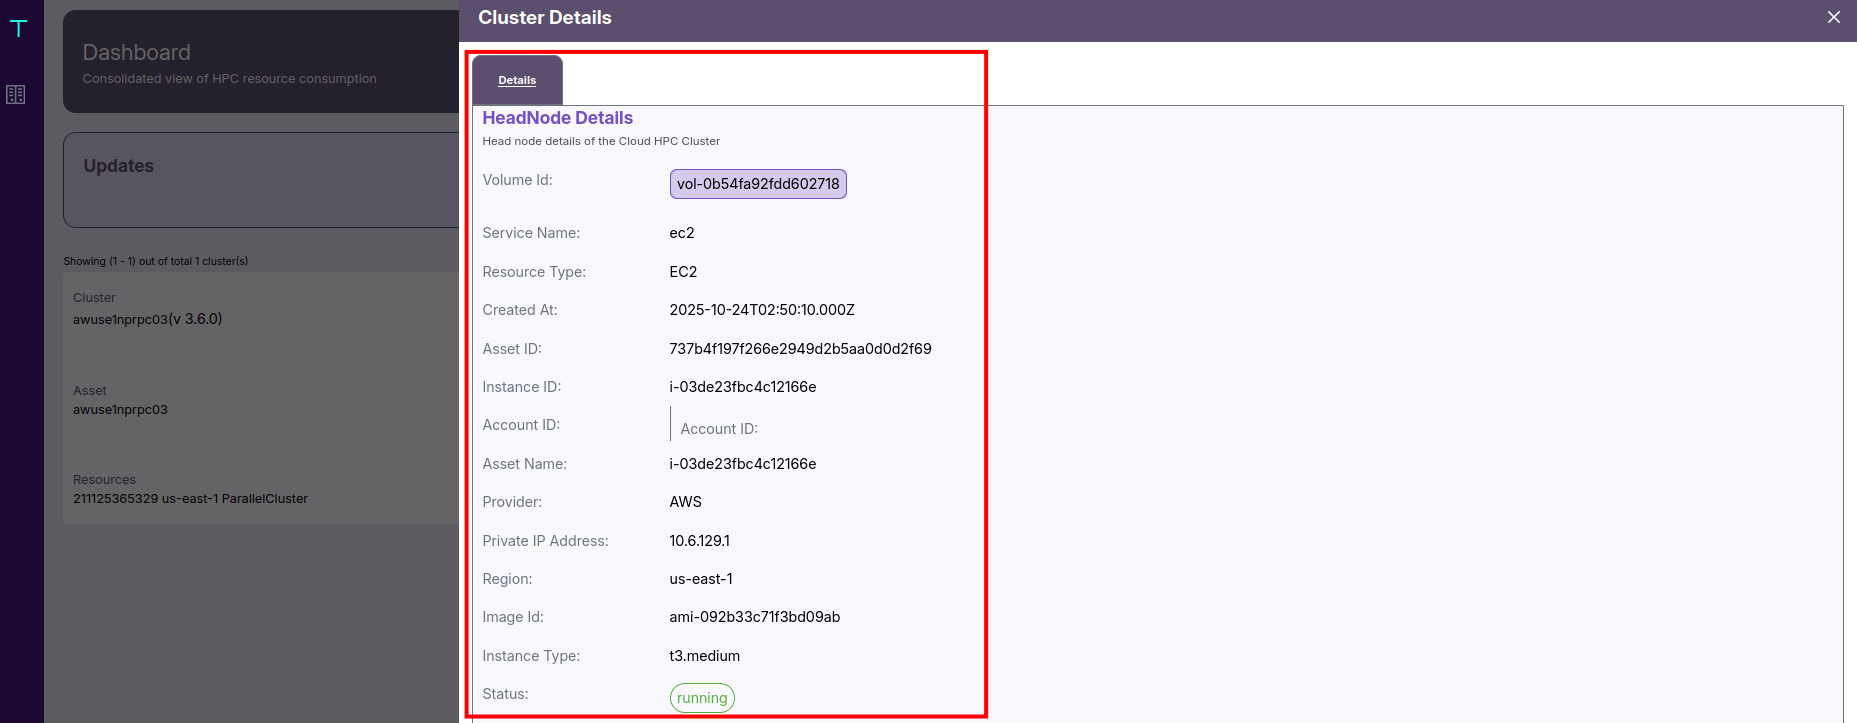
🖥️ HeadNode Details
- You can view the Instance ID, Private IP, Instance Type, and Image ID.
- It also includes the Volume ID, current Status (such as running), Region, and Creation Timestamp.
- This helps admins validate the node’s operational health and configuration.
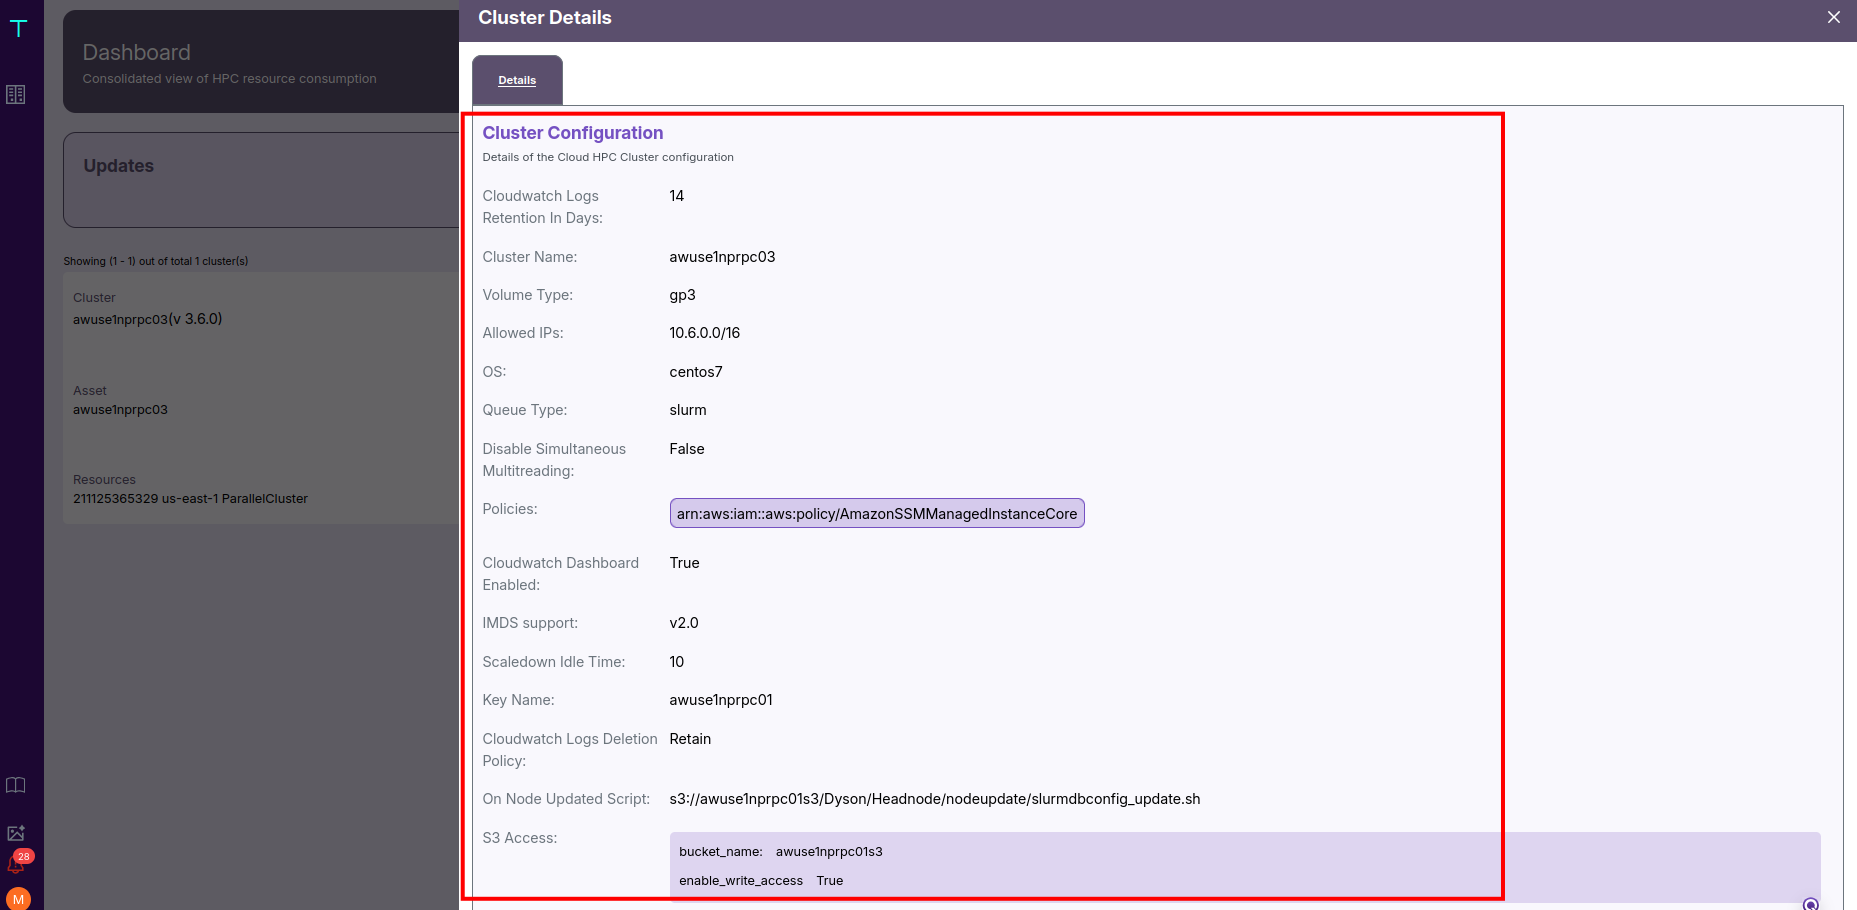
⚙️ Cluster Configuration Details
Here, you can see:
- The Operating System (e.g., CentOS 7) and Scheduler Type (e.g., Slurm).
- Networking rules, like allowed IP ranges (e.g.,
10.6.0.0/16). - Storage settings, such as volume type (
gp3), size (100 GB), and encryption status. - Scaling behavior, including idle time before scale-down (e.g., 10 minutes).
- Monitoring options, such as whether CloudWatch metrics and detailed monitoring are enabled.
- Startup and update scripts, often stored in S3, which define cluster lifecycle actions.
- IAM Policies, granting access to required AWS services.
- S3 bucket access, indicating if write access is enabled.
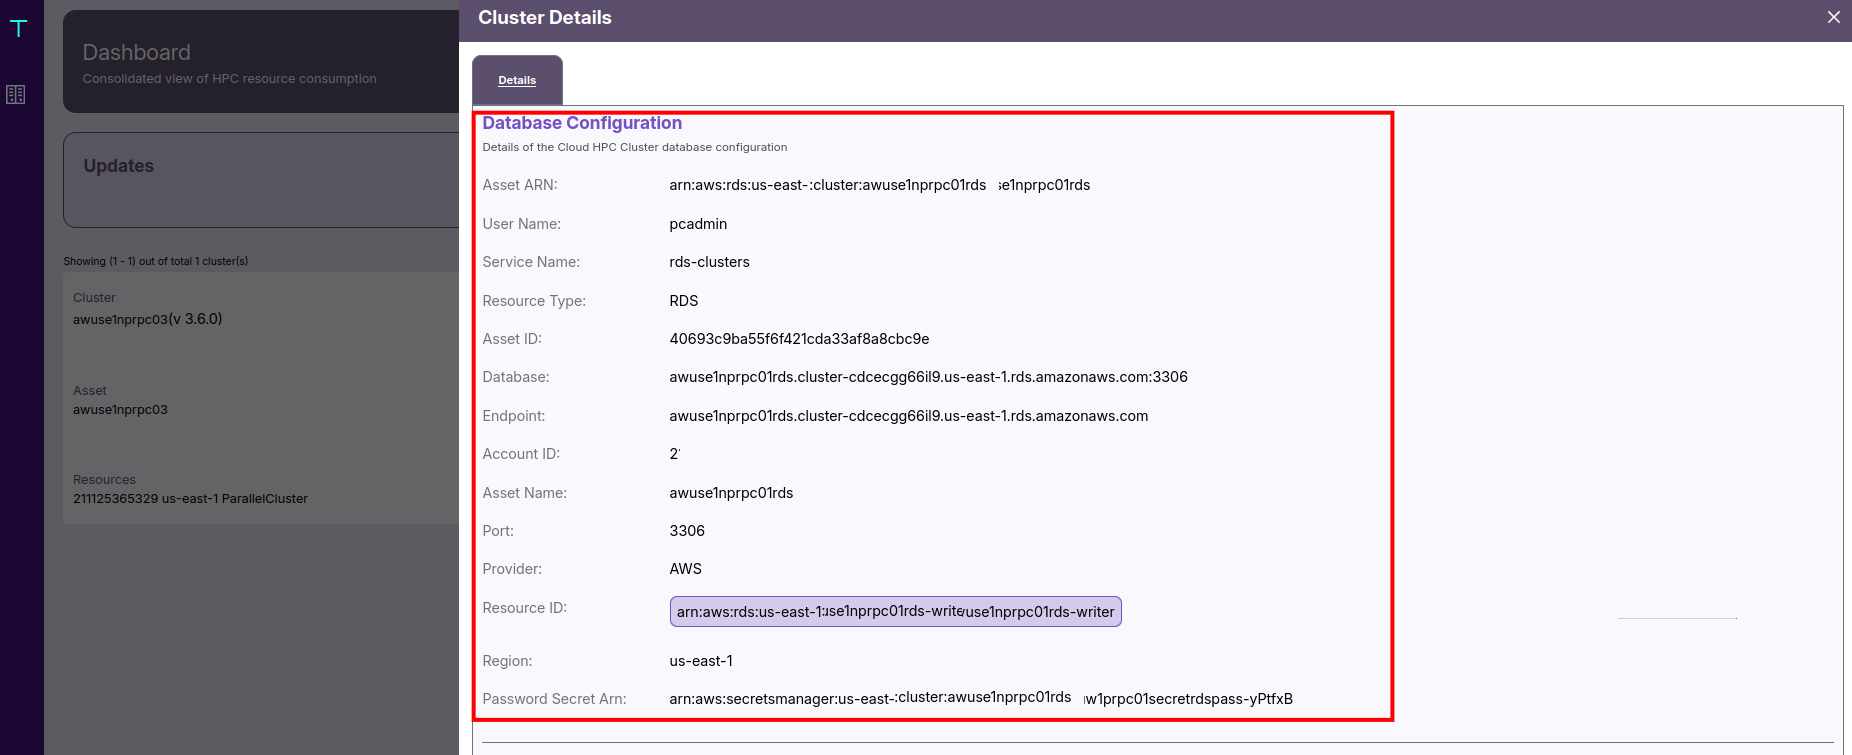
🗄️ Database Configuration
You’ll find:
- The Database Type (such as Amazon RDS).
- The ARN, which uniquely identifies the RDS cluster.
- The Endpoint and Port, used for connections.
- The Username for access, and a Secret ARN referencing credentials stored securely in AWS Secrets Manager.
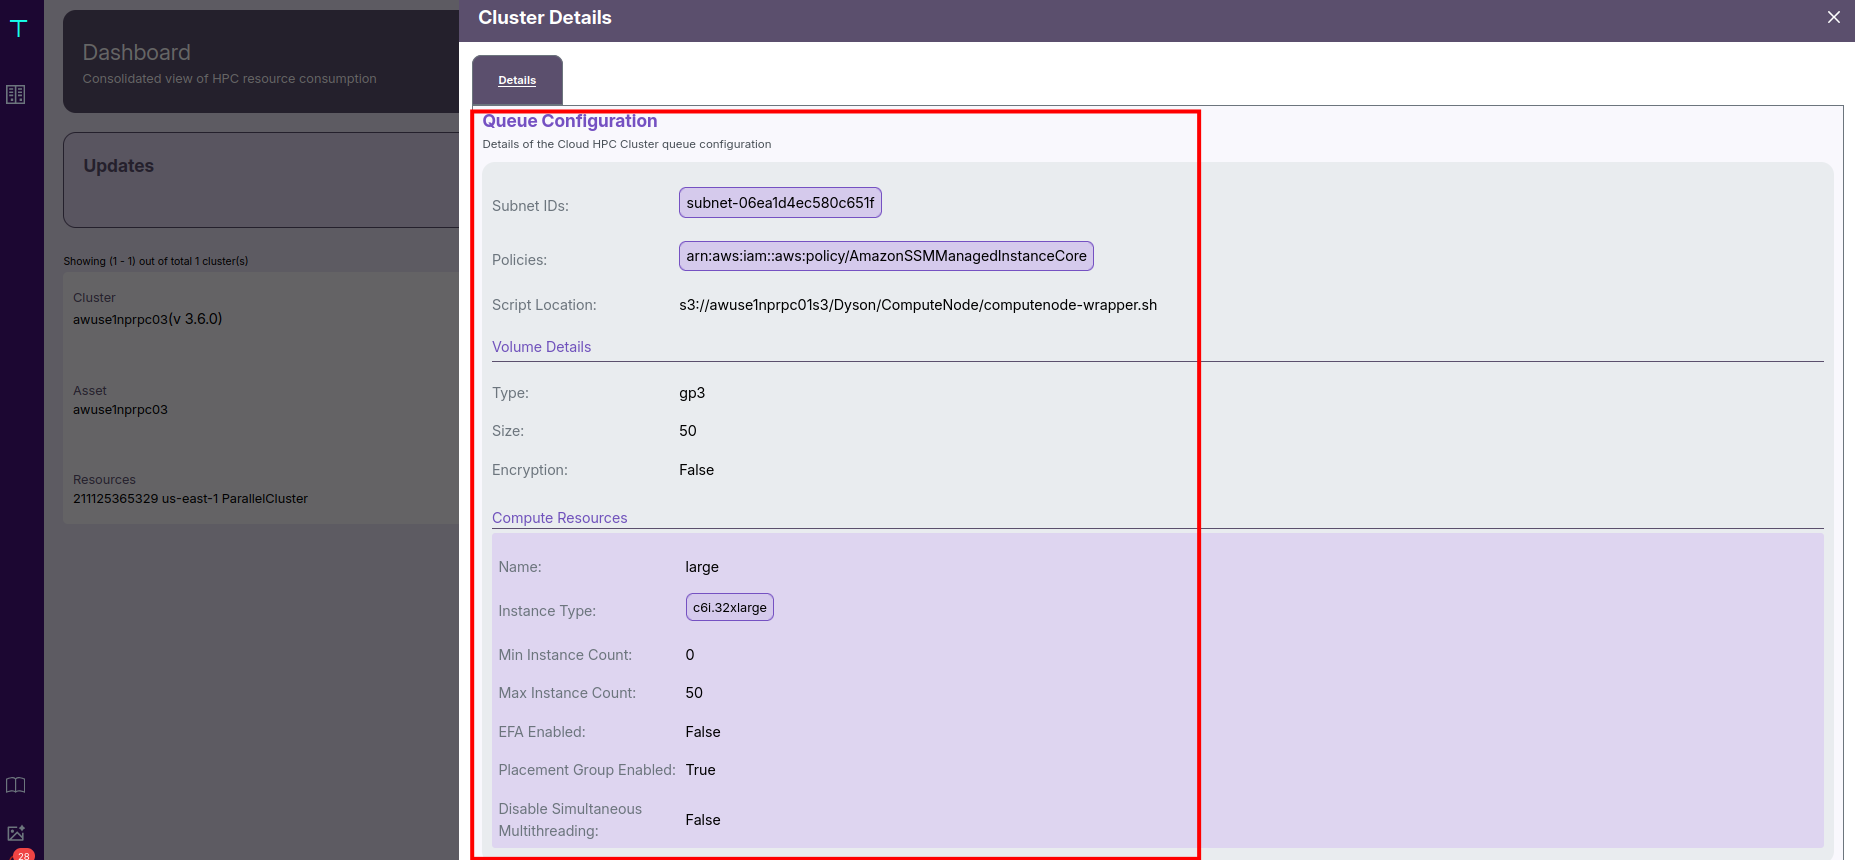
🧠 Queue Configuration
Each queue defines the compute capacity and scaling behavior:
- Instance Type: e.g.,
c6i.32xlarge - Minimum and Maximum Instance Counts: determine elasticity and job throughput.
- EFA (Elastic Fabric Adapter): indicates whether high-performance networking is enabled.
- Placement Group: shows whether instances are co-located for low latency.
- Subnet ID and Startup Script Location are also displayed to help identify resource placement and automation scripts.
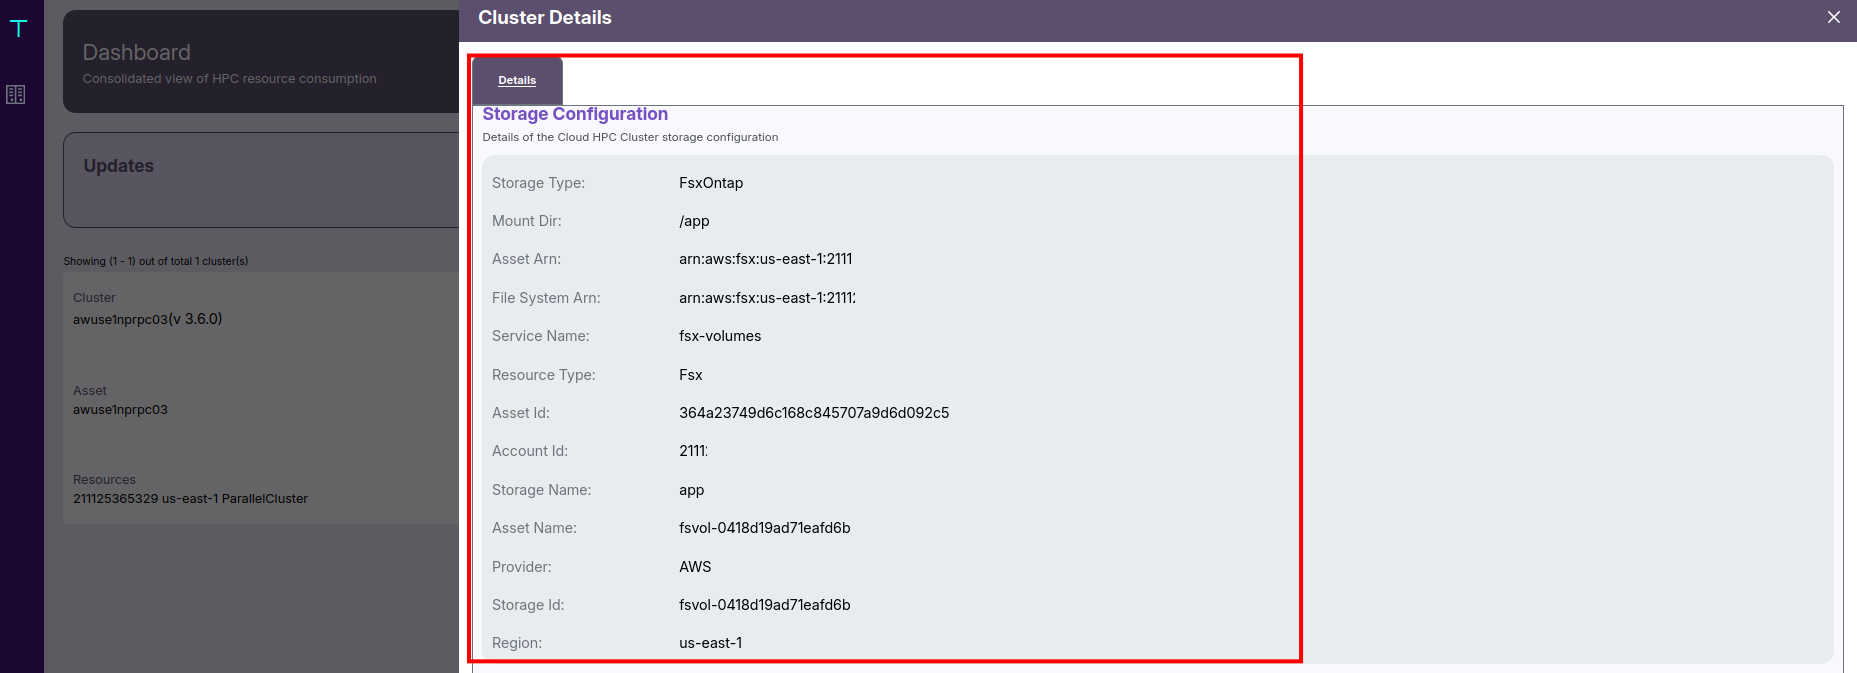
🗃️ Storage Configuration
For each mount point (e.g., /app), you can view:
- The File System ARN and Volume ARN, identifying the exact FSx resources used.
- The Storage Type (FSx for ONTAP), Region, and Provider (AWS).
This ensures that admins can trace storage configurations directly to their AWS resources.
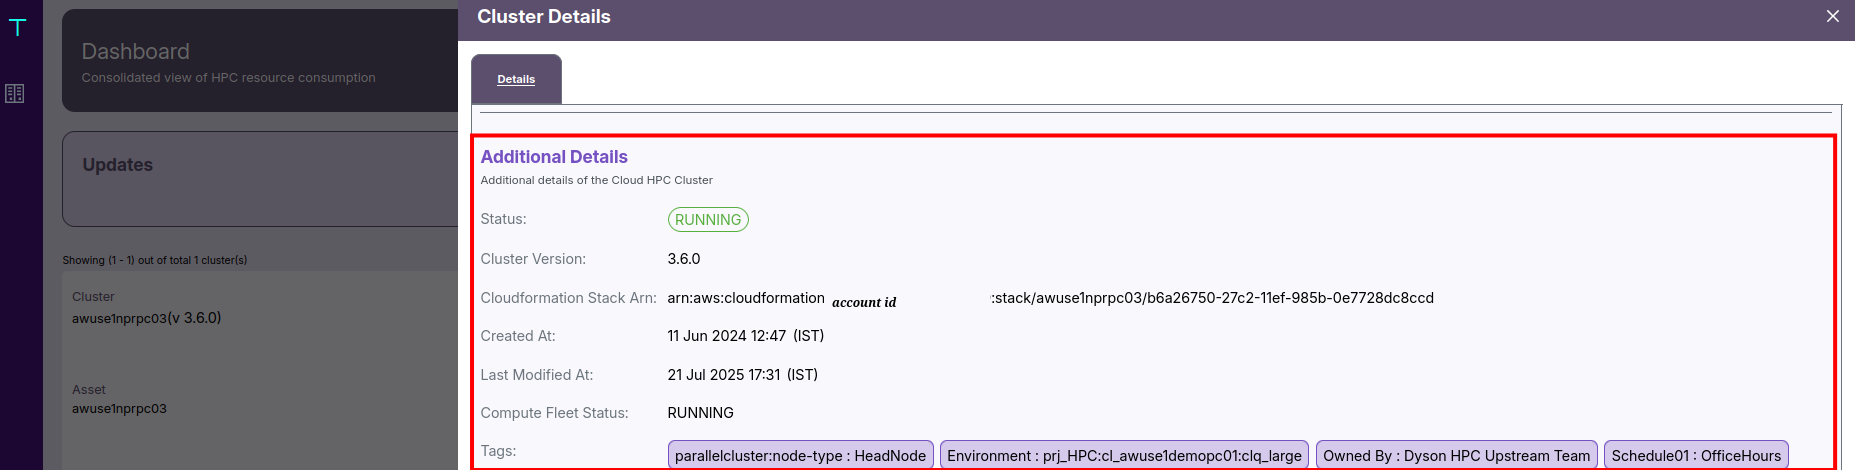
🏷️ Additional Details
It includes:
- Status: Indicates whether the cluster and its compute fleet are currently RUNNING.
- Cluster Version: Specifies the installed ParallelCluster version (e.g., 3.6.0).
- Stack ARN: Identifies the AWS CloudFormation stack managing the cluster’s infrastructure.
- Created and Modified Timestamps: Help track deployment and maintenance history.
- Tags: Provide metadata like
Environment: prj_HPC,Schedule: OfficeHours, or other custom identifiers.
- This detailed popup view offers a unified summary across Cloud, Network, Storage, and Compute configurations.
- Admins can use it to verify infrastructure health, validate configuration consistency, and troubleshoot deployment issues efficiently.
📈 Cluster Dashboard Metrics
cluster Metrics view open when click on expand view near detail button. it will provide the entire resouse used under cluster like jobs, workstation, resources usages and so on.
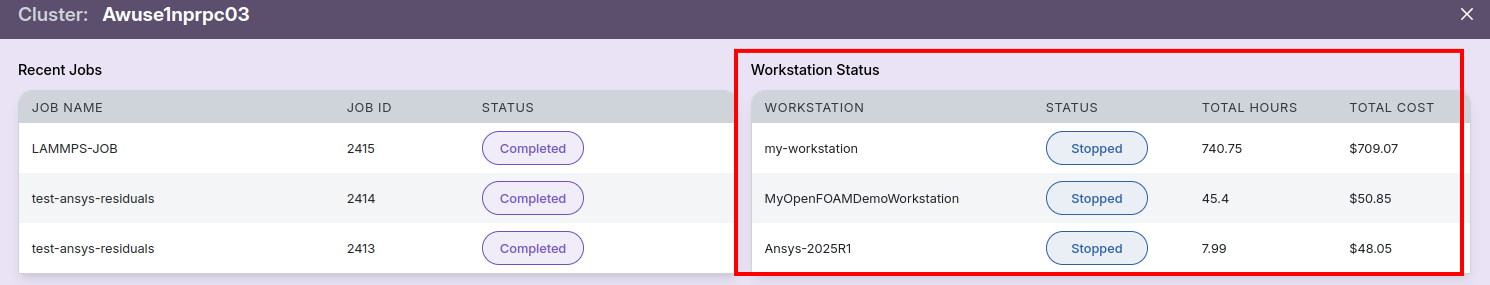
🧾 Recent Jobs
Displays job IDs, names, users, and completion states (Completed, Failed, Cancelled).
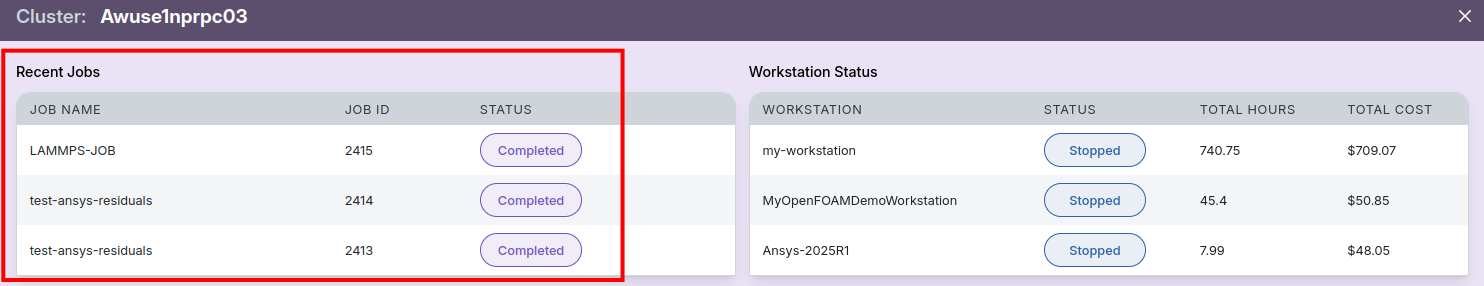
💻 Workstation Status
Lists all workstations with current state, usage hours, and cost breakdown.
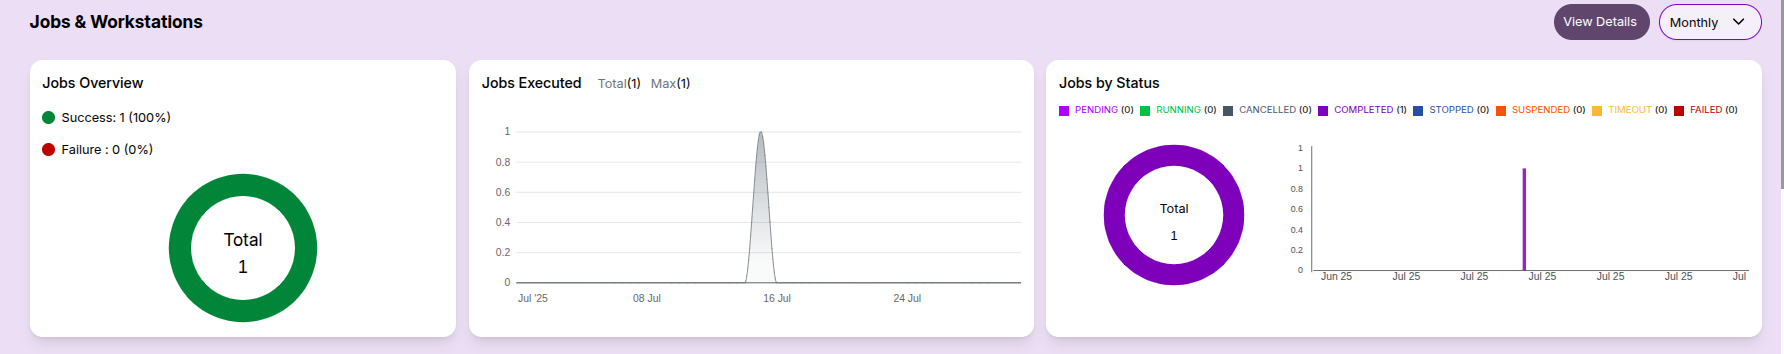
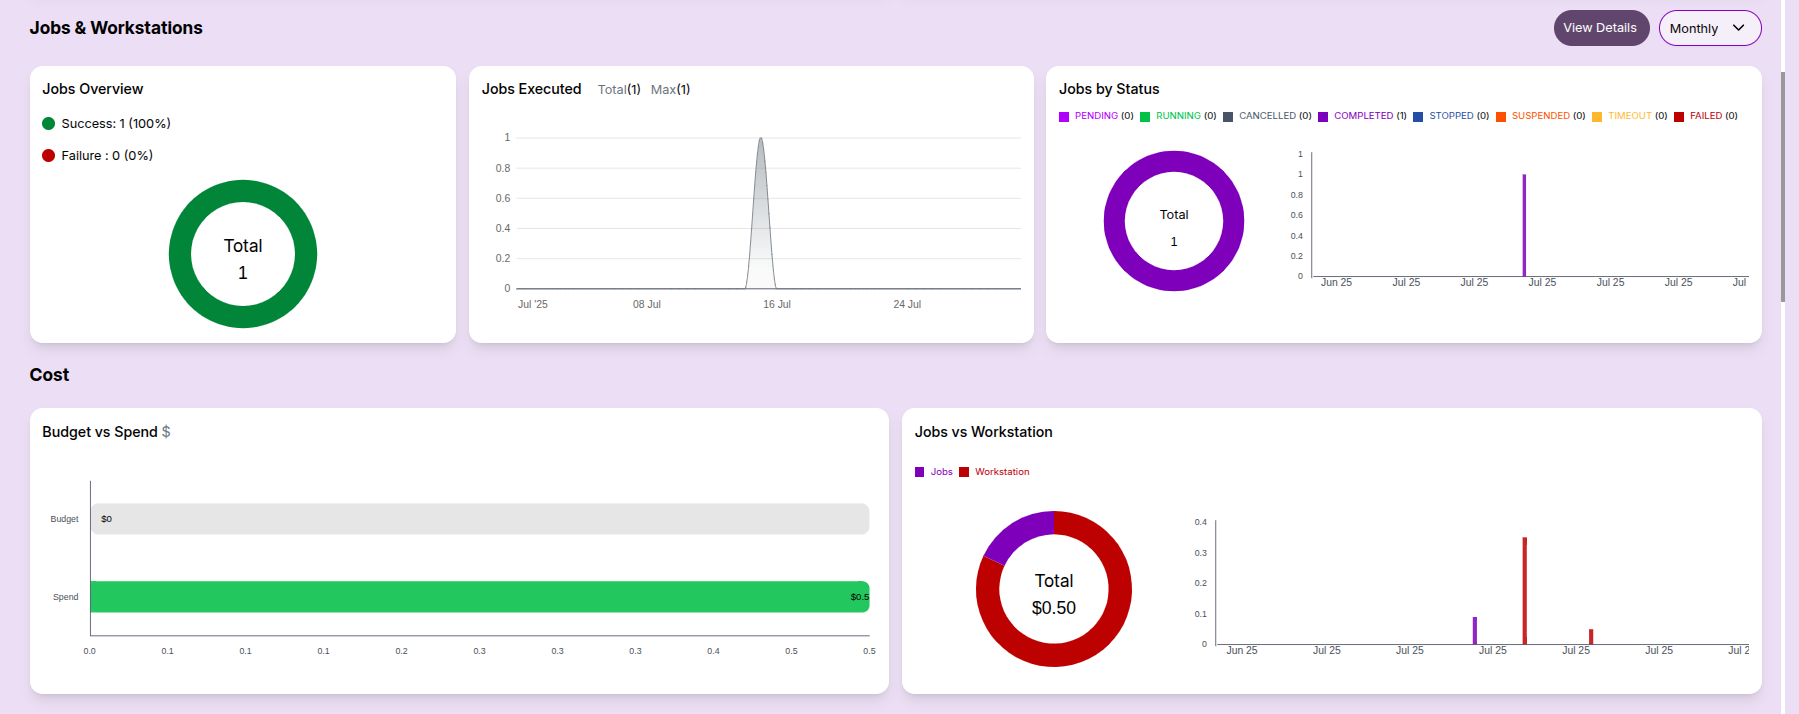
Jobs & Workstations Summary:
- Job status overview (success/failure)
- Execution trends and status distribution
Cost Overview:
- Budget vs Spend: This bar chart compares the allocated budget with the actual spend.
- Cost Breakup: Distribution of spend across jobs, workstations, and services.
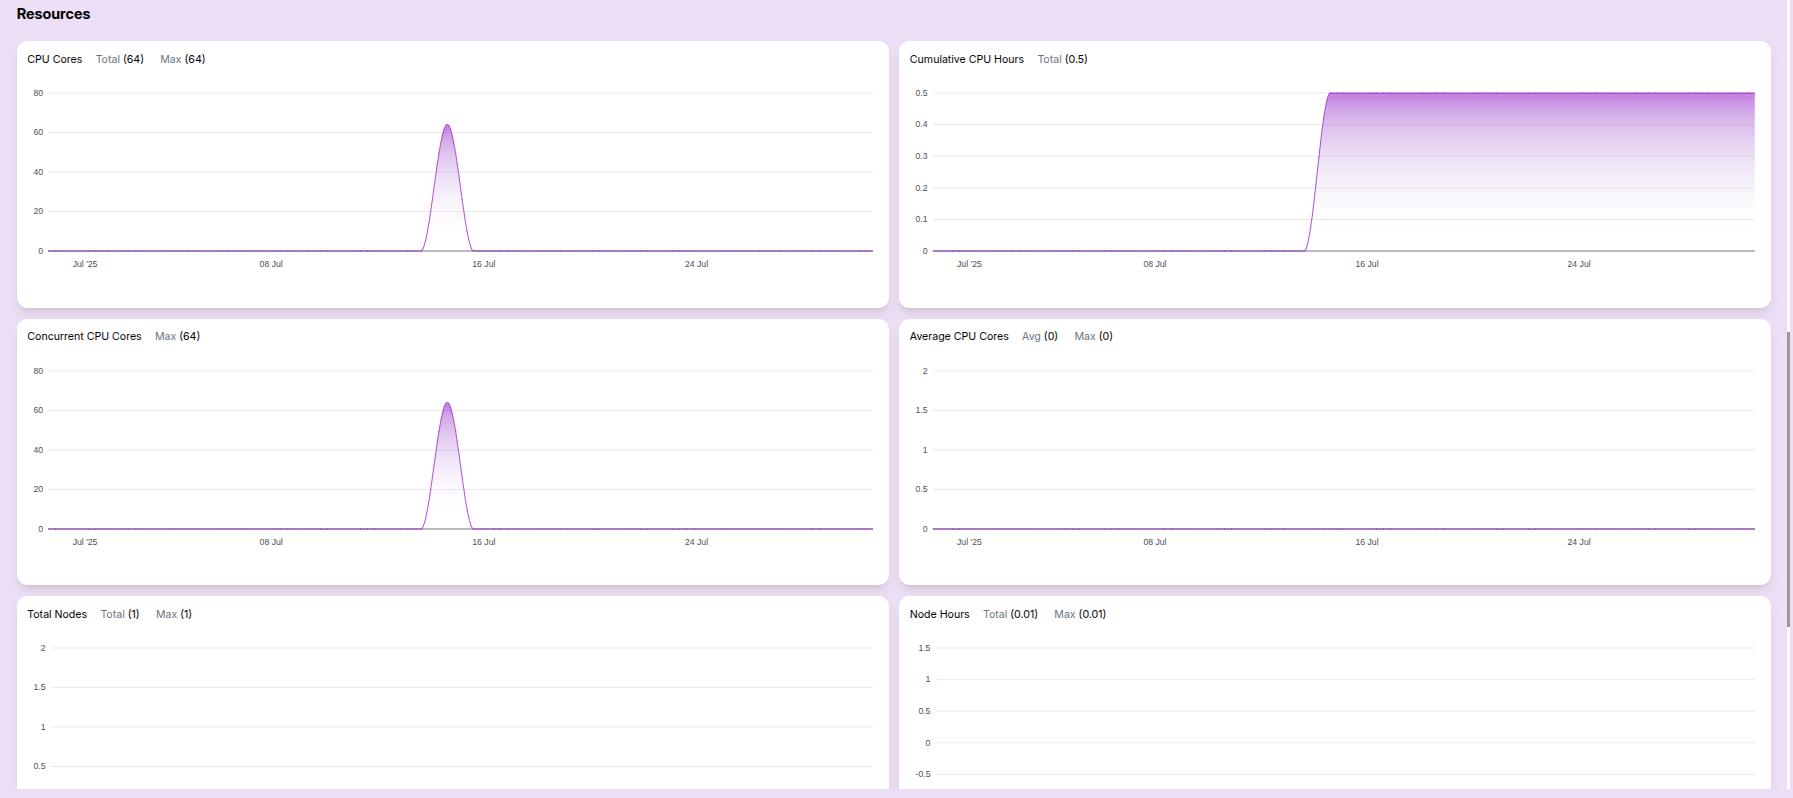
Resource Metrics:
- CPU cores usage: Helpful for tracking total capacity vs actual usage.
- Concurrent CPU cores: Useful for analyzing parallel job load.
- Cumulative CPU hours: Indicates total resource engagement.
- Average CPU usage: Shows average core usage over time.
- Total Nodes: Indicates the number of nodes provisioned.
- Node Hours: Highlights node utilization efficiency.
These metrics help users analyze both performance and cost at a glance.
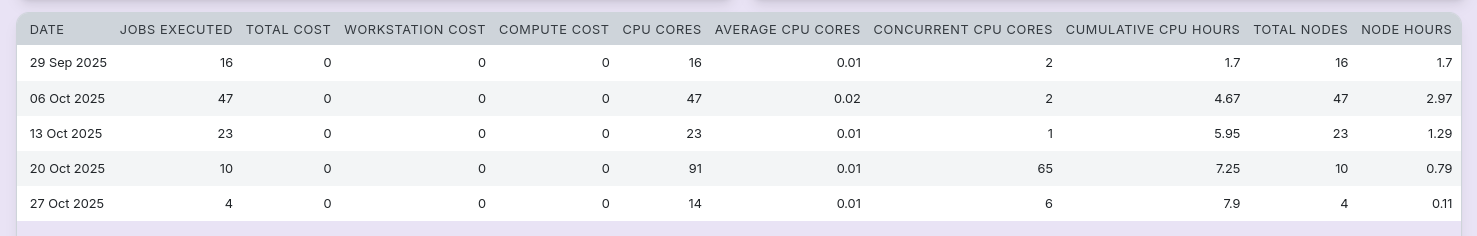
Computational Resource Report
This documentation provides a daily overview of job execution statistics, cost allocations, CPU metrics, and node utilization. It's designed to help teams monitor performance and optimize resource consumption.
Table View:
- Consolidated reports for the user are listed in this table, aggregated by monthly, daily, or weekly intervals.
This dashboard helps users monitor their resource consumption and job history across clusters in a visual format.
- The Dashboard Metrics view is available for all types — Cluster, Queue, User, and Project.
- Each type provides a similar detailed view of jobs, workstations, resource usage, and cost metrics.
-
📌 General Notes
- If you encounter any UI issues or have questions about job submissions or status, please contact the Admin for support.
- Ensure you have selected the correct cluster, region, and provider when filtering Dashboard.