Budget and Cost
Breaks down resource usage and associated costs across multiple dimensions — project, cluster, queue, user, job, and workstation — and compares them against their allocated budgets. This allows for precise tracking of spending patterns, early detection of cost anomalies, and identification of budget overruns. By offering both granular and aggregated cost views, it enables better financial planning, accountability, and optimization of resource allocation.
Note:
- All reports listed Below follow the same functionality as HPC018 — they support filters, drilldown options, schedule creation, and export capabilities (Excel and PDF).
- For a step-by-step walkthrough, see the detailed explanation under HPC018, the same steps apply to all other reports.
HPC018 – Cluster Budget and Spend Cost Report
This report shows the total spend cost aggregated at the cluster level for a given period.
Filters Available and Usage
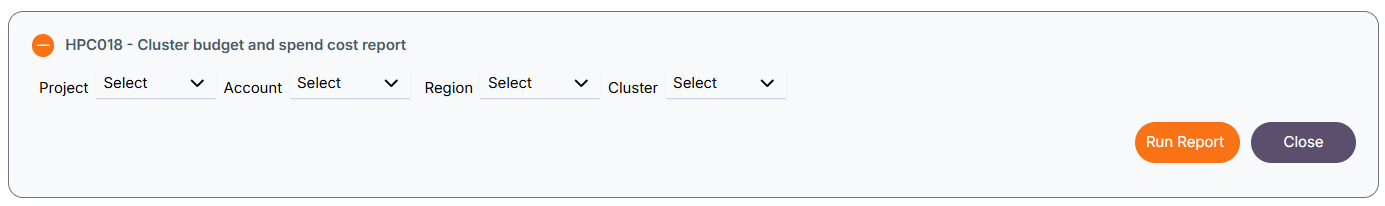 The following filters are available:
- Provider – e.g., AWS, Azure.
- Account – Cloud account to narrow scope.
- Region – Geographic data center region.
- Cluster – Compute cluster to analyze.
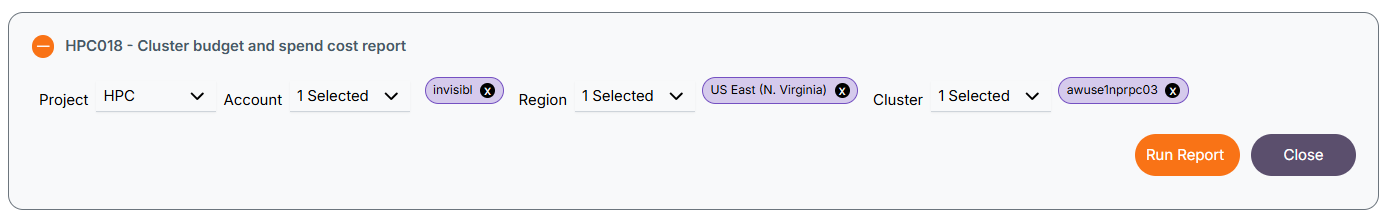
When one or more filters are selected, the report displays data accordingly based on the selected Project, Account, Region, Cluster, Queue, or User.
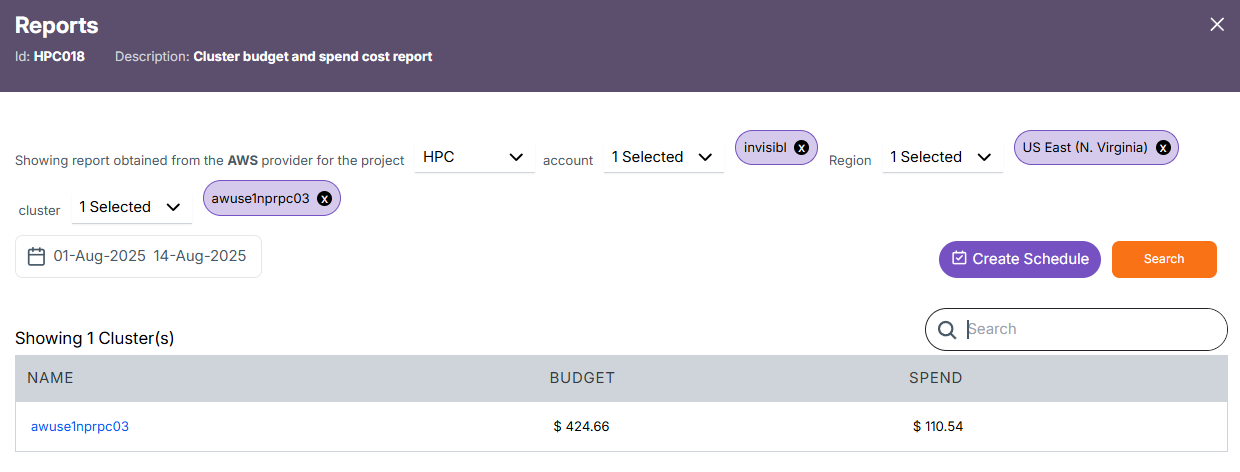
Clicking the Run Report button without selecting any filters will generate full data without any filtering. The structure will look as shown below:
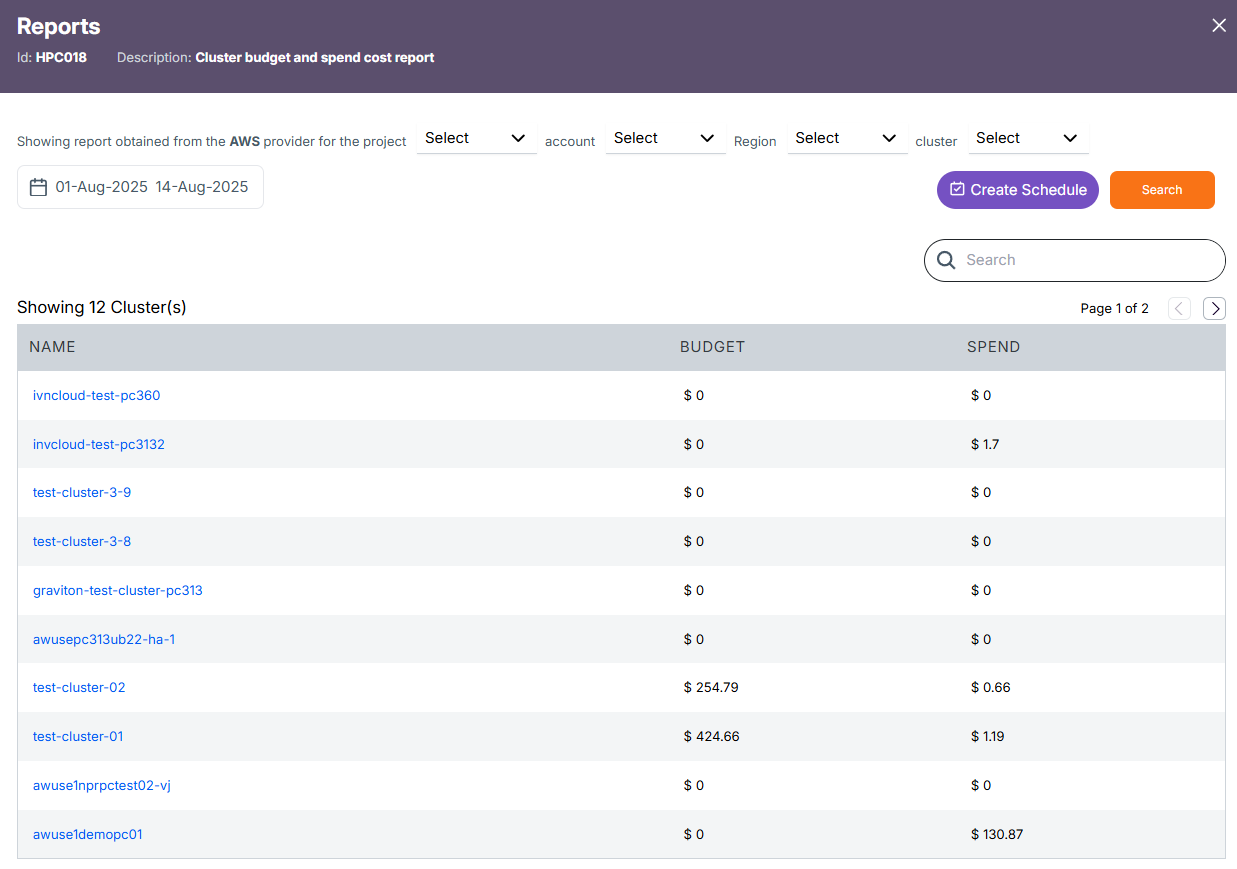
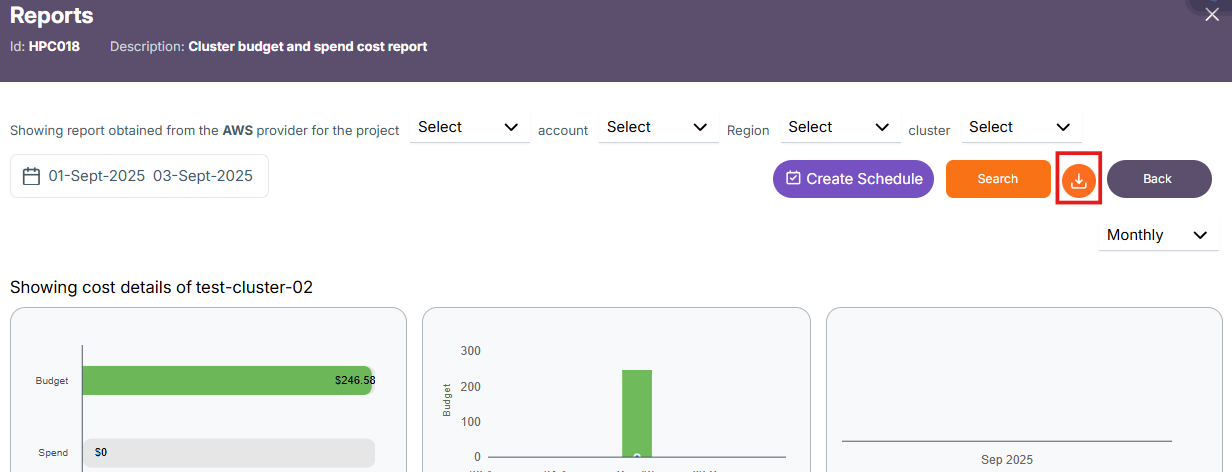
By clicking on any one of the cluster names, you can view a detailed report for that particular cluster in both table and graphical formats.
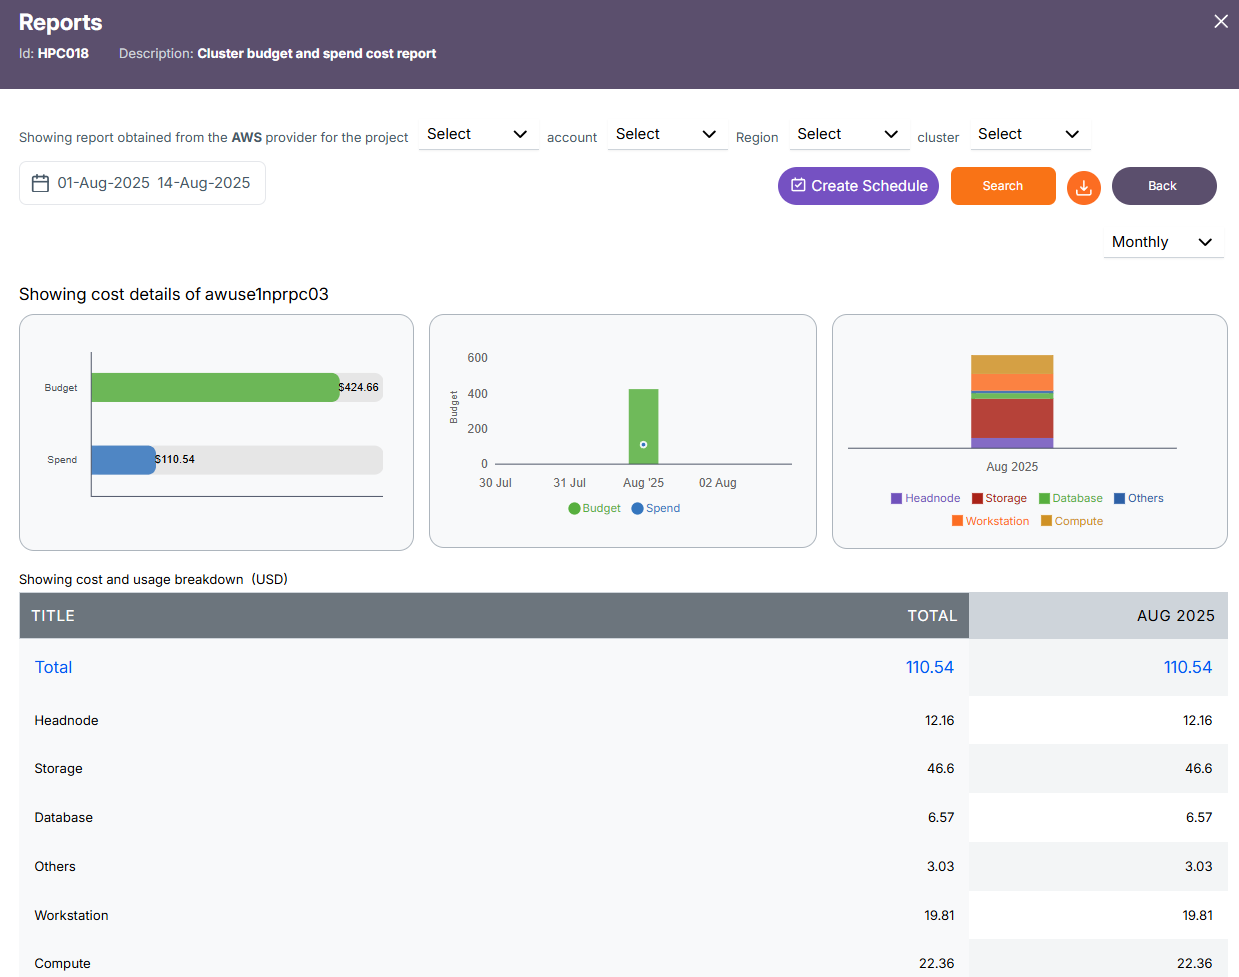
Budget vs Spend Bar Chart (Left)
-
Displays the allocated budget (green) and actual spend (blue) for the selected cluster.
-
Helps quickly identify budget utilization and remaining funds.
Budget/Spend Over Time Chart (Center)
-
Shows how budget and spend values trend over a timeline.
-
Allows tracking of spending patterns and peak usage dates.
Category-wise Spend Breakdown (Right)
-
Uses a stacked bar chart to visualize spending distribution across resource categories.
-
Categories include Headnode, Storage, Database, Others, Workstation, and Compute, each with a distinct color
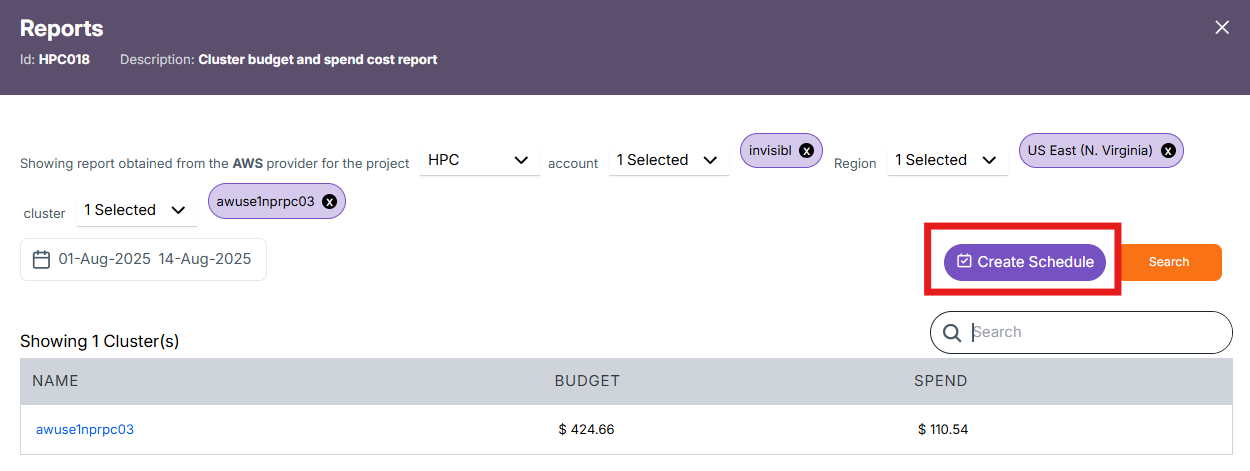
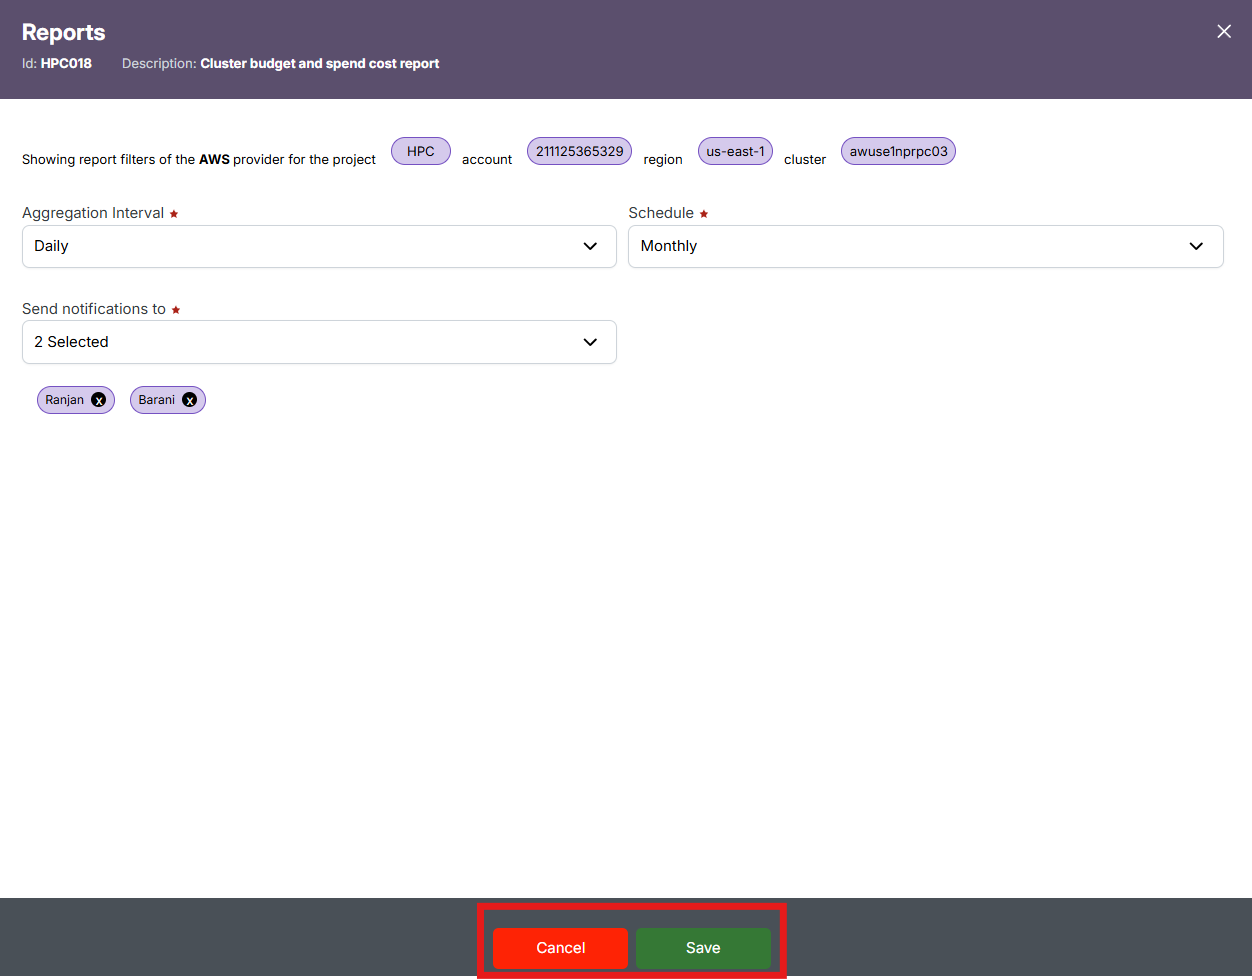
Schedule Creation
The Create Schedule feature allows you to automate report generation. Instead of manually selecting filters and running reports each time, you can schedule the report to run at regular intervals (e.g., daily, weekly) and have it emailed or stored for easy access.
-
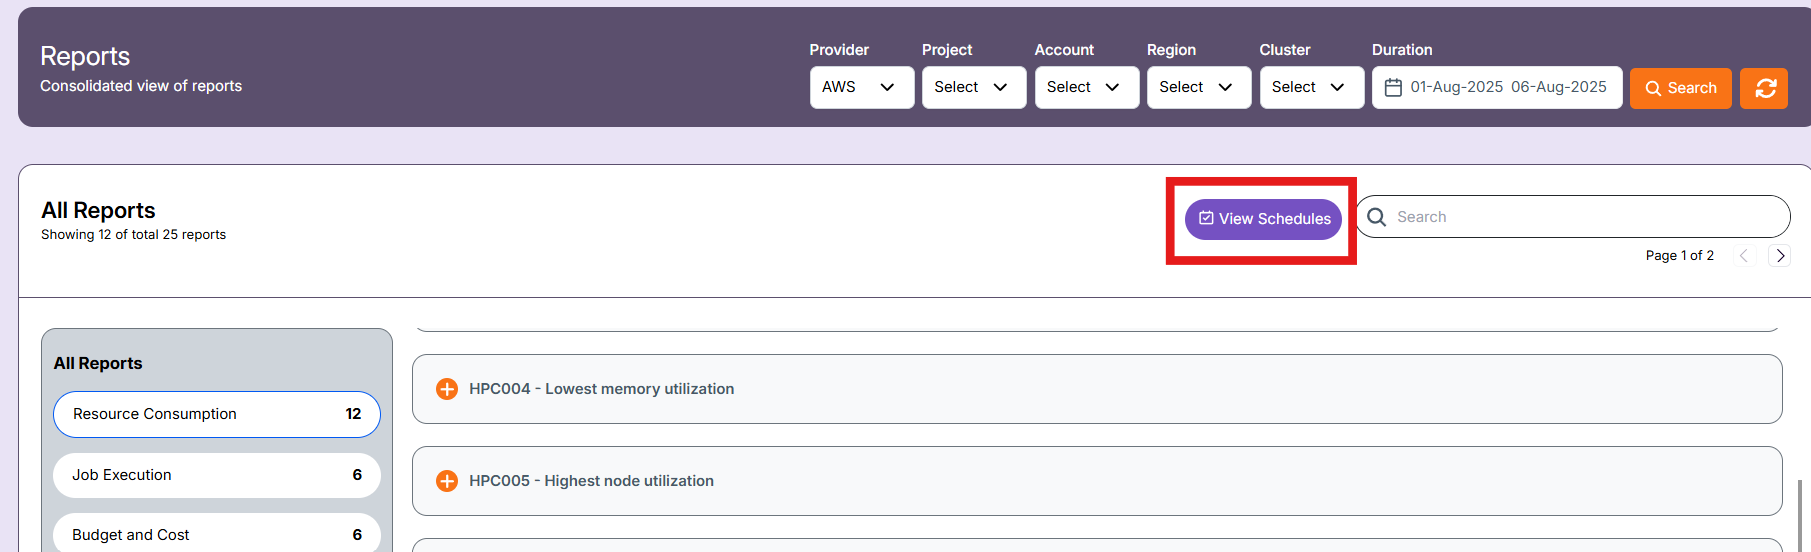
Click on the Create Schedule button located near the top-right, beside the Search button.
-
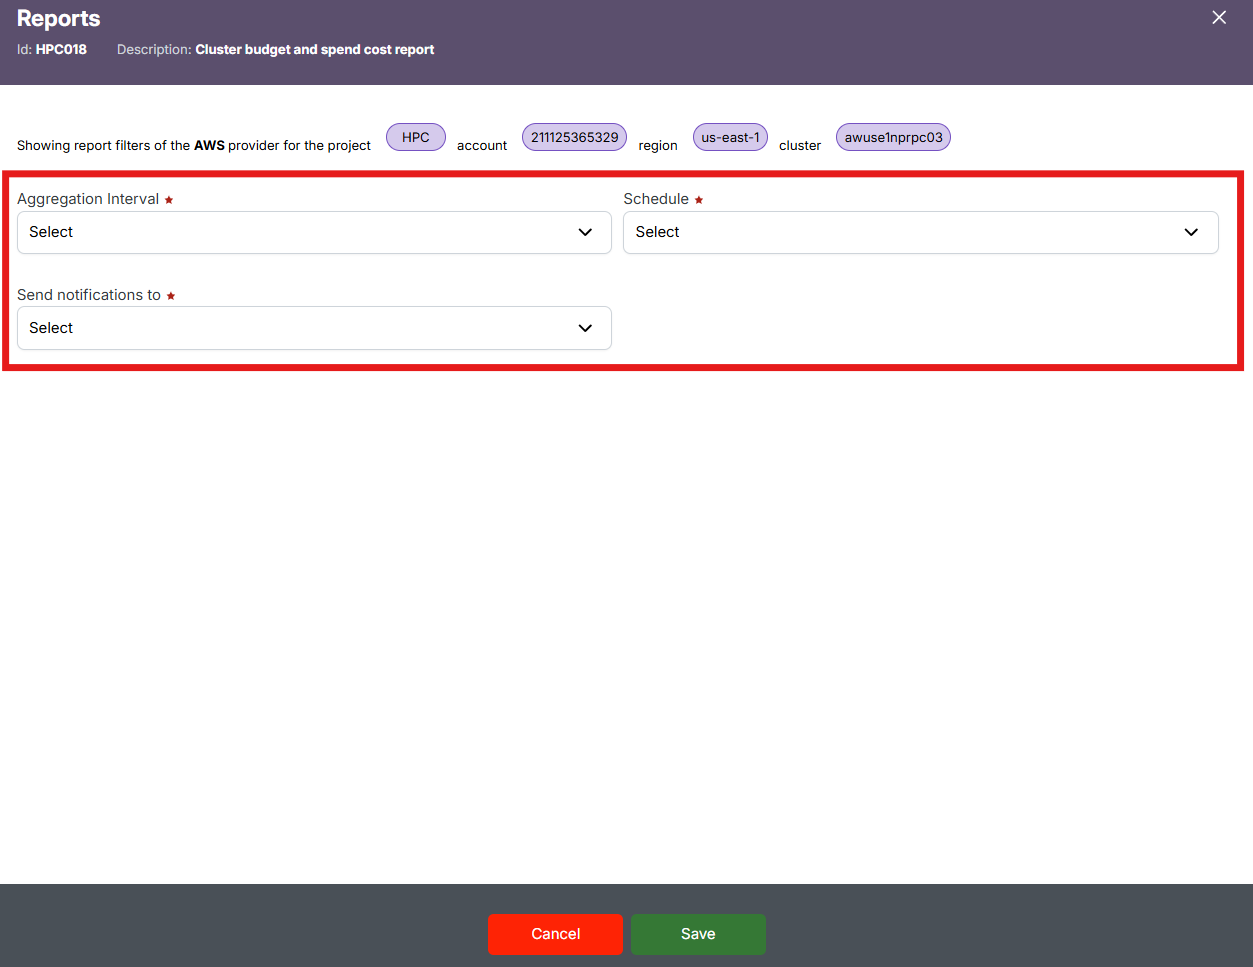
In the "Schedule" dropdown, select a schedule frequency (e.g., Daily, Weekly) and in "aggregation interval" dropdown is the time period over which data is grouped before being reported or processed. and in the "Send notifications to" dropdown, choose the user(s) who should receive alerts when the report is generated.
-
Review the applied filters displayed at the top (like Provider, Project, Account, Region, Cluster, Queue, and User) – these will be locked to the schedule.
-
Click "Save" to finalize the schedule or "Cancel" to discard the setup.
-
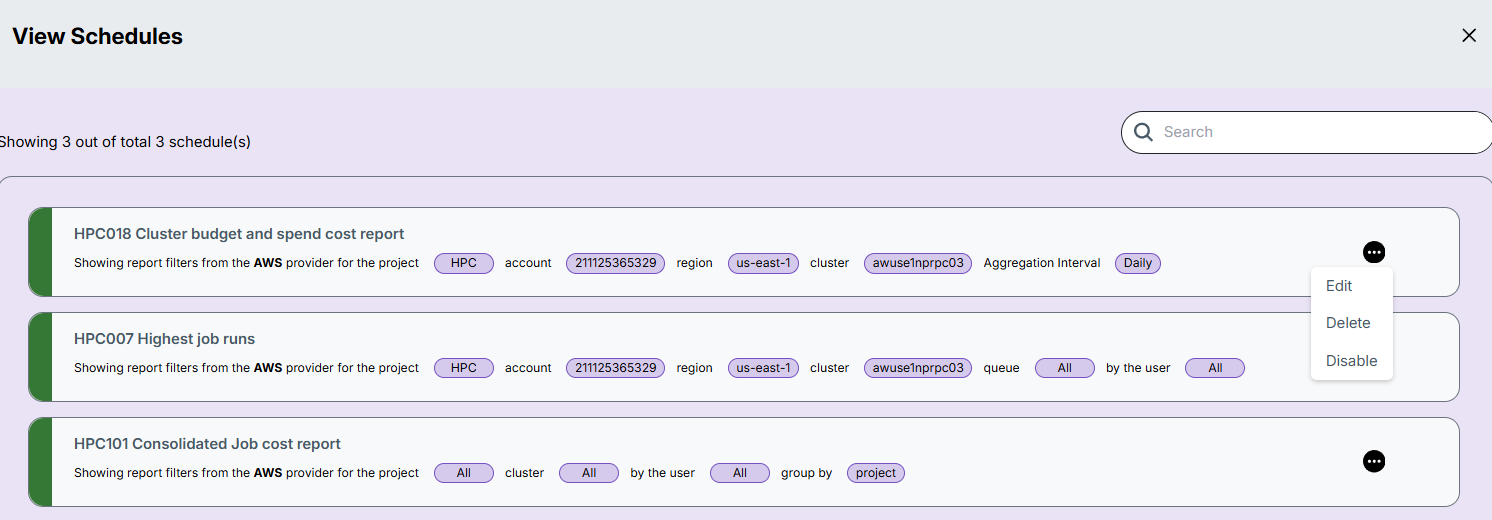
After saving the schedule, you can view them in the "view schedule" in landing page of report section.
-
There are three actions that can be performed on a schedule:
- Edit – Update schedule settings such as filters, time, or recipients.
- Delete – Remove the schedule permanently.
- Enable/Disable – Temporarily activate or deactivate the schedule without deleting it.
Export Report
The Download button at the top right corner allows you to export the report data in Excel format:
- Excel (.xlsx): Contains the tabular report data based on selected filters.
Export Formats: Excel and PDF
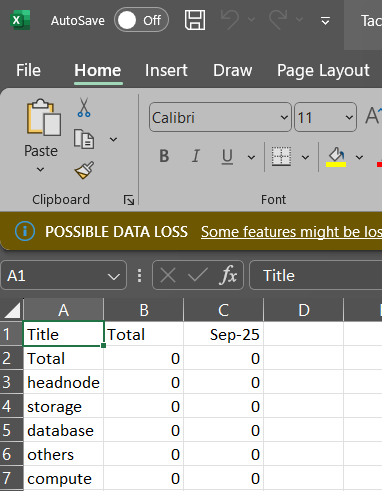
Excel
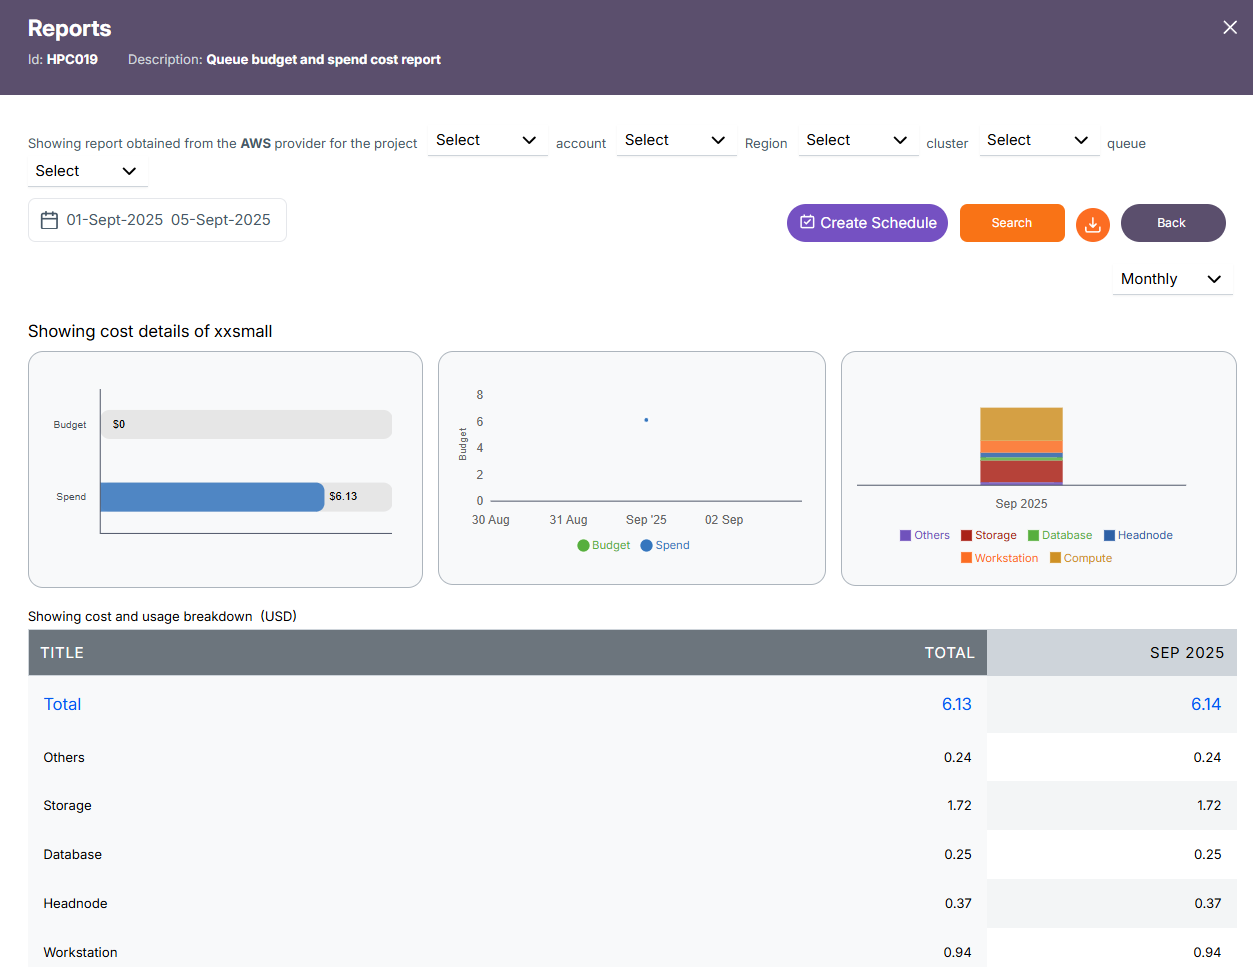
HPC019 – Queue Budget and Spend Cost Report
-
Aggregates total spend cost per queue for a given period.
-
Helps track cost efficiency and utilization across different queues.
-
Supports decision-making for workload distribution and budget control.
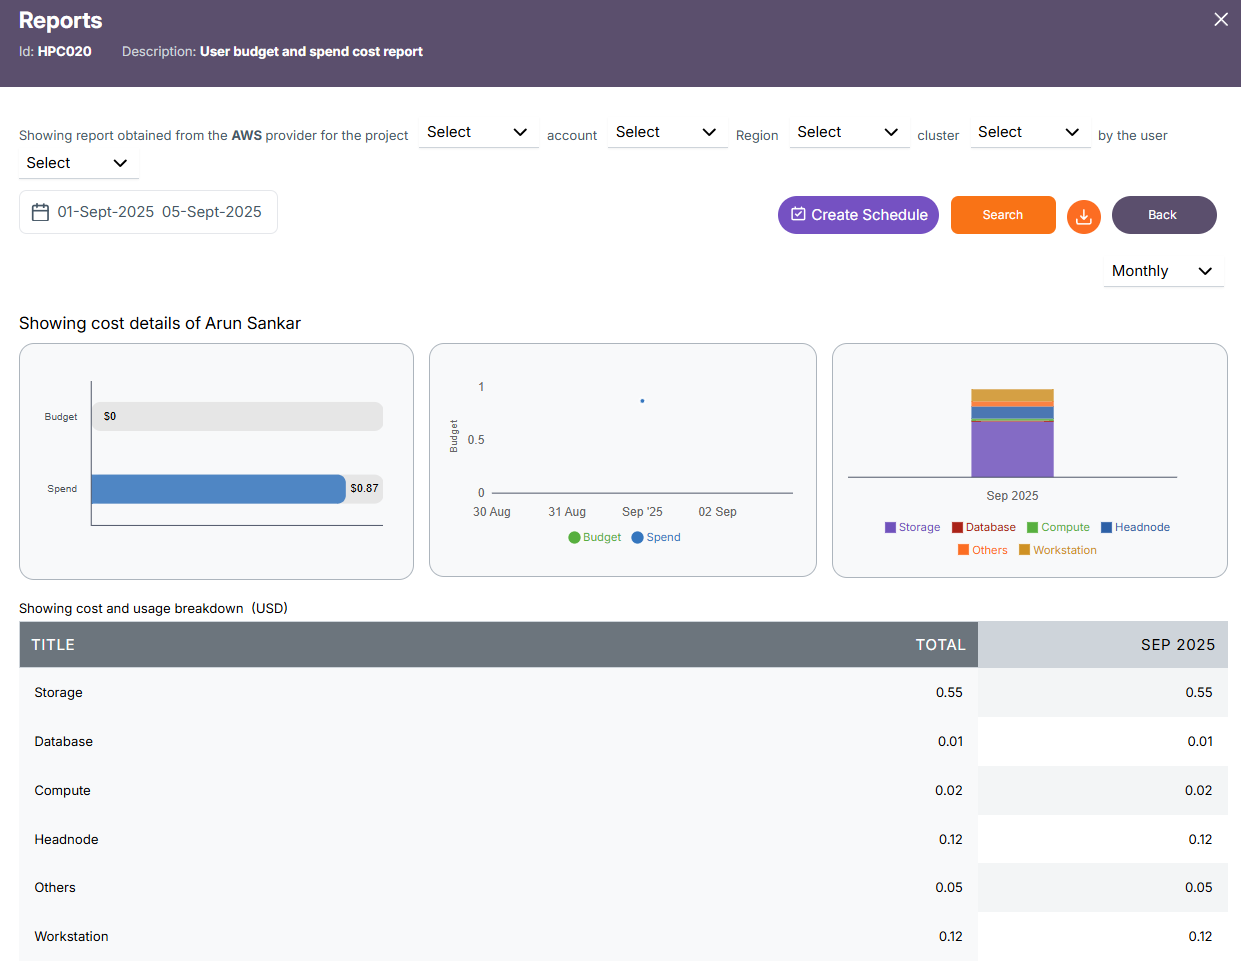
HPC020 – User Budget and Spend Cost Report
-
Aggregates total spend cost per user for a given period.
-
Helps monitor heavy users and ensure fairness in resource usage.
-
Supports chargeback/showback and user-level budget allocation.
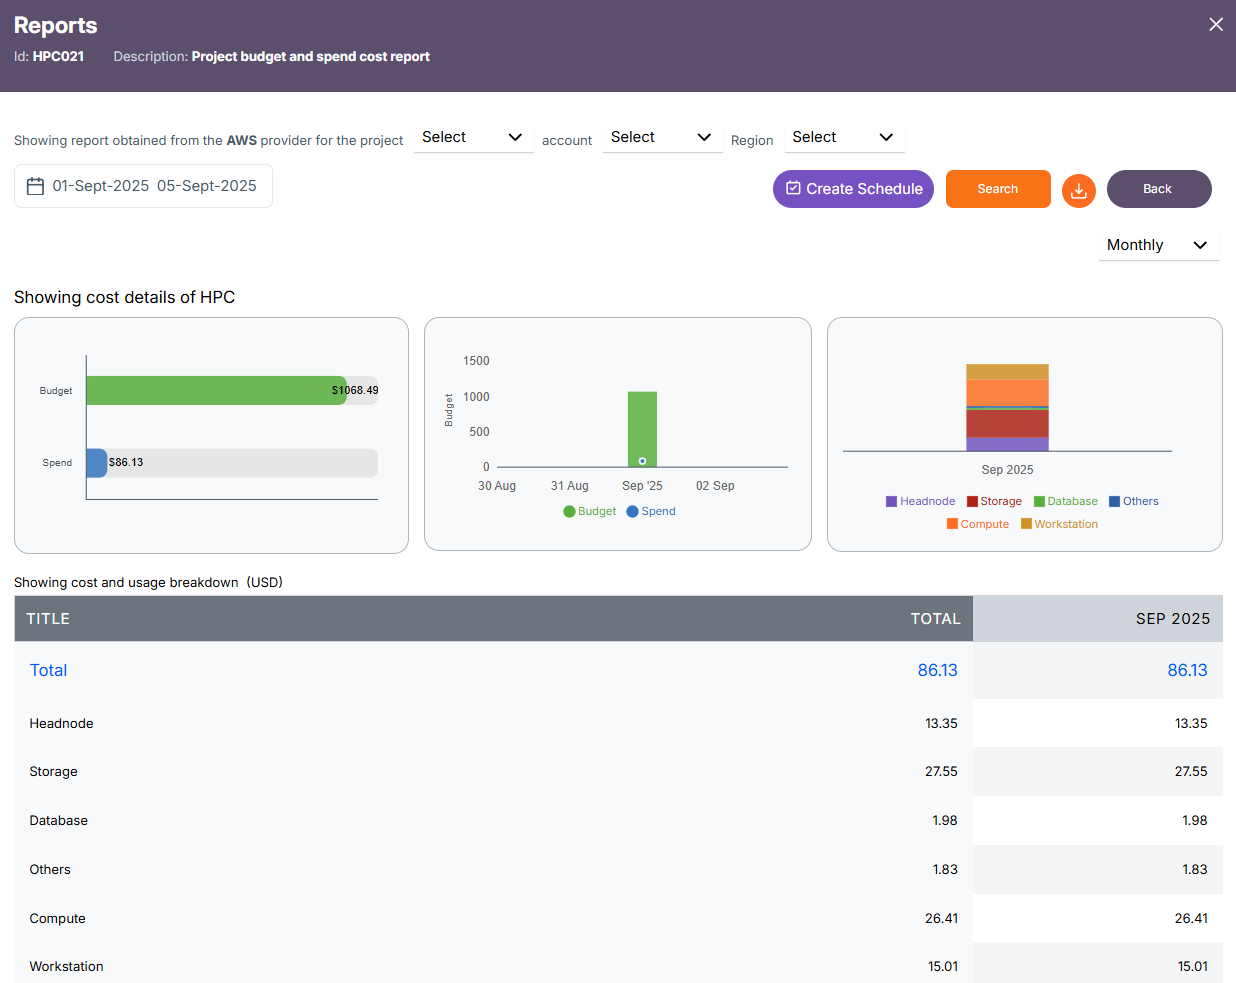
HPC021 – Project Budget and Spend Cost Report
-
Aggregates total spend cost per project across all jobs.
-
Provides visibility into project-level budget consumption.
-
Helps forecast and control project spending requirements.
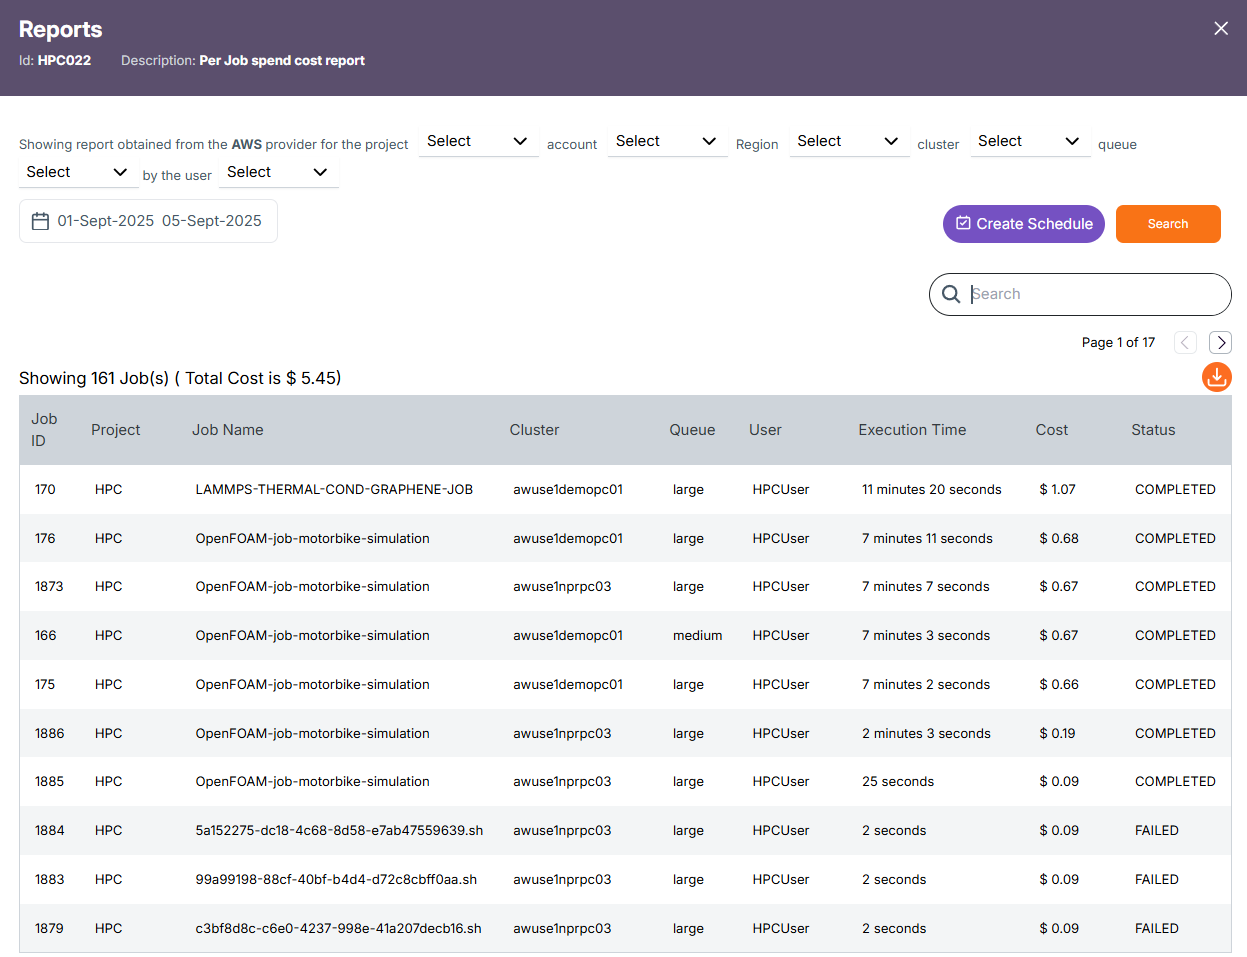
HPC022 – Per Job Spend Cost Report
-
Breaks down spend cost at the individual job level.
-
Identifies expensive or inefficient jobs for optimization.
-
Supports transparency in billing and detailed cost tracking.
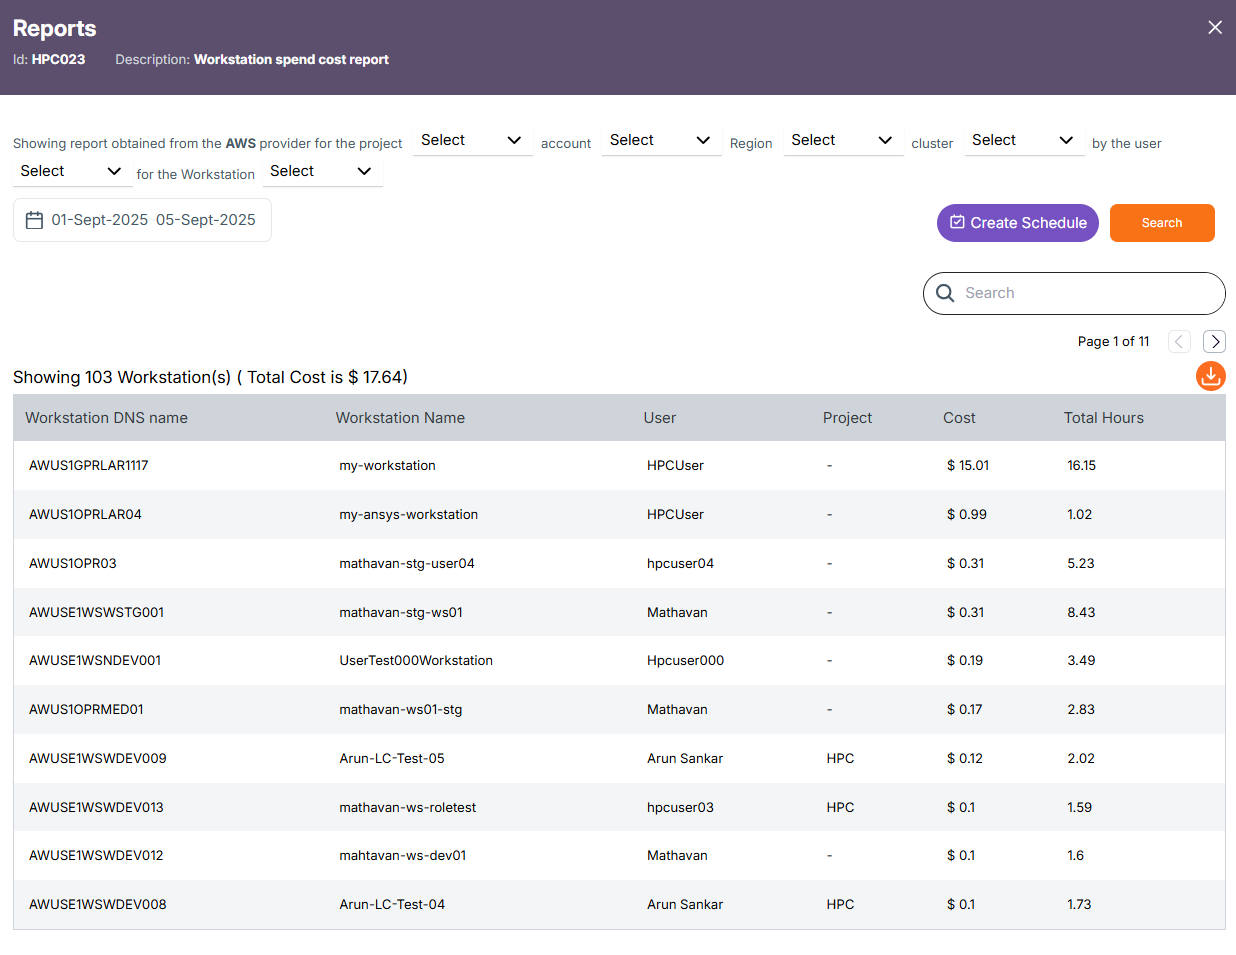
HPC023 – Workstation Spend Cost Report
-
Aggregates total spend cost per workstation or compute node.
-
Highlights high-cost or underutilized systems.