Dashboard
Overview
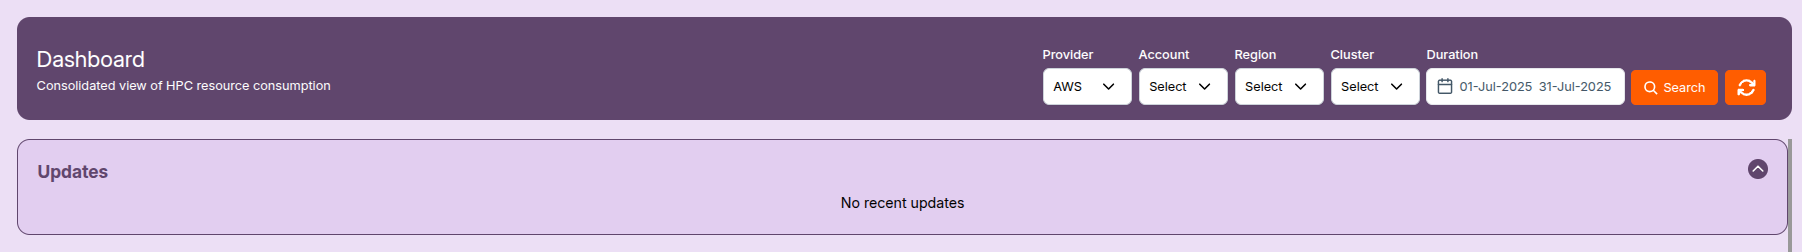
The Dashboard offers a consolidated view of High Performance Computing (HPC) resource consumption across multiple clusters. It allows users to analyze CPU utilization, cumulative usage hours, average resource consumption, and cost across various clusters.
Filters
At the top of the dashboard, users can refine the displayed data using the following filters:
- Provider: Select the cloud provider (e.g., AWS)
- Account: Filter by specific cloud account
- Region: Filter clusters by region
- Cluster: Choose the cluster you want to monitor
- Duration: Date range selection (e.g., 01-Jul-2025 to 31-Jul-2025)
Click Search to apply the selected filters and refresh the dashboard view.
Updates
The Updates section displays real-time announcements or changes.
Usage Summary
- Recent Jobs: List of completed jobs with job ID and status.
- Workstation Status: Status, usage hours, and cost for each workstation.
-
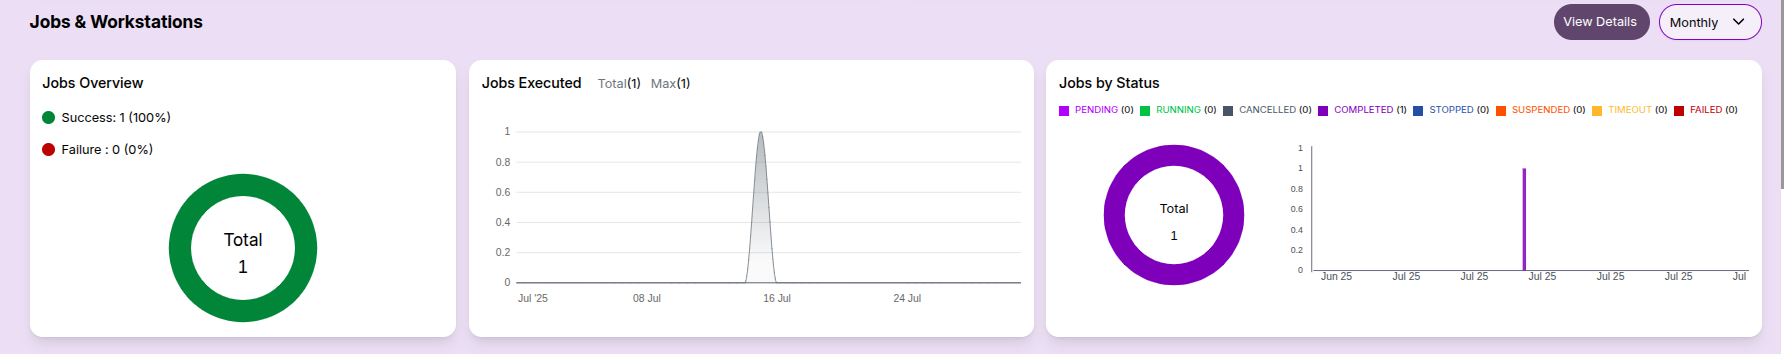
Jobs & Workstations Summary:
-
Job status overview (success/failure)
- Execution trends and status distribution
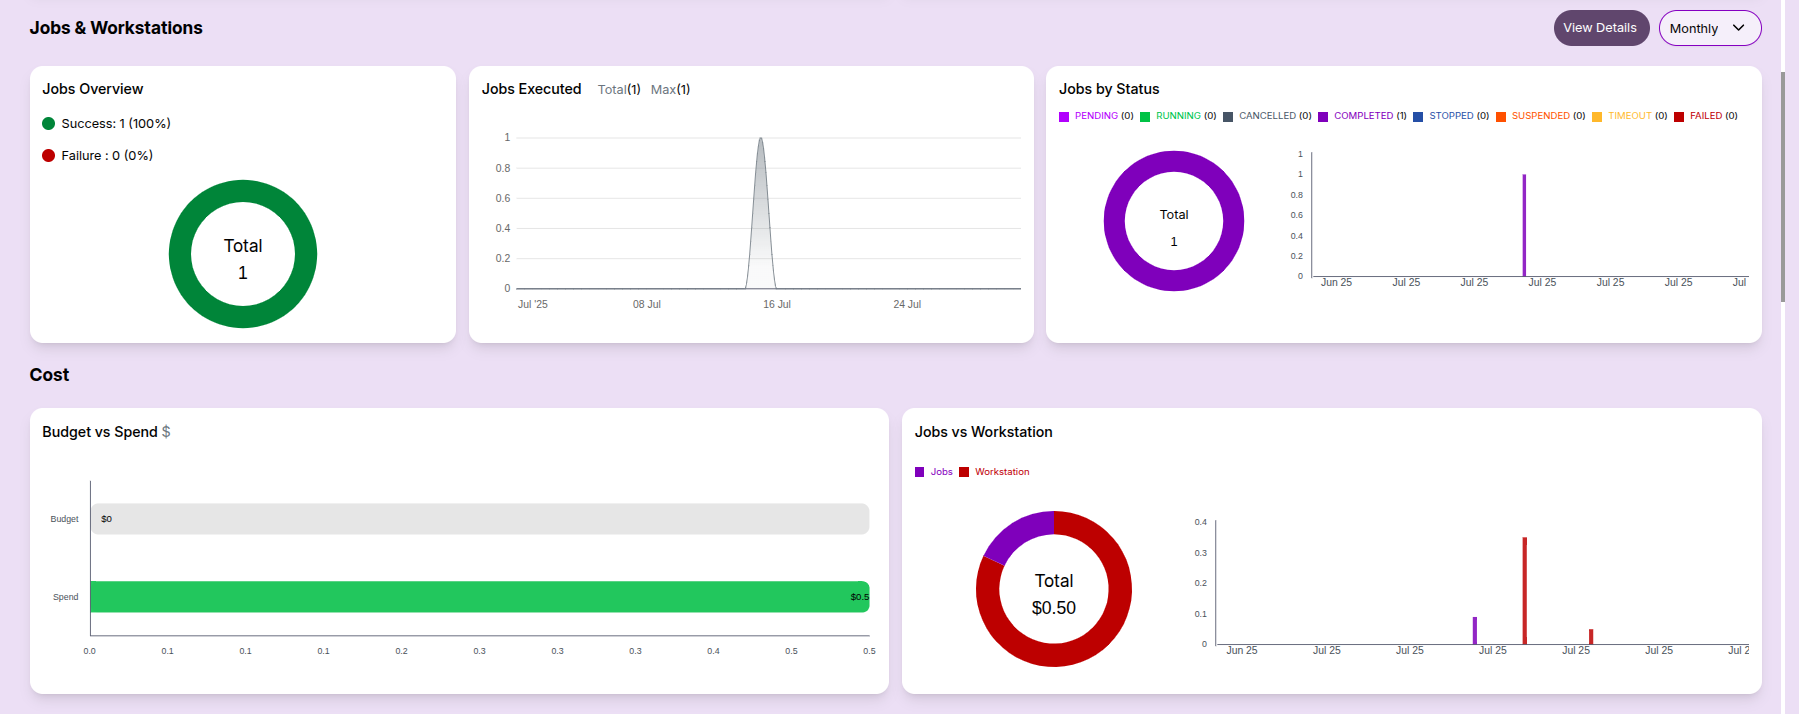
Cost Overview:
- Budget vs Spend: This bar chart compares the allocated budget with the actual spend.
- Cost Breakup: Distribution of spend across jobs, workstations, and services.
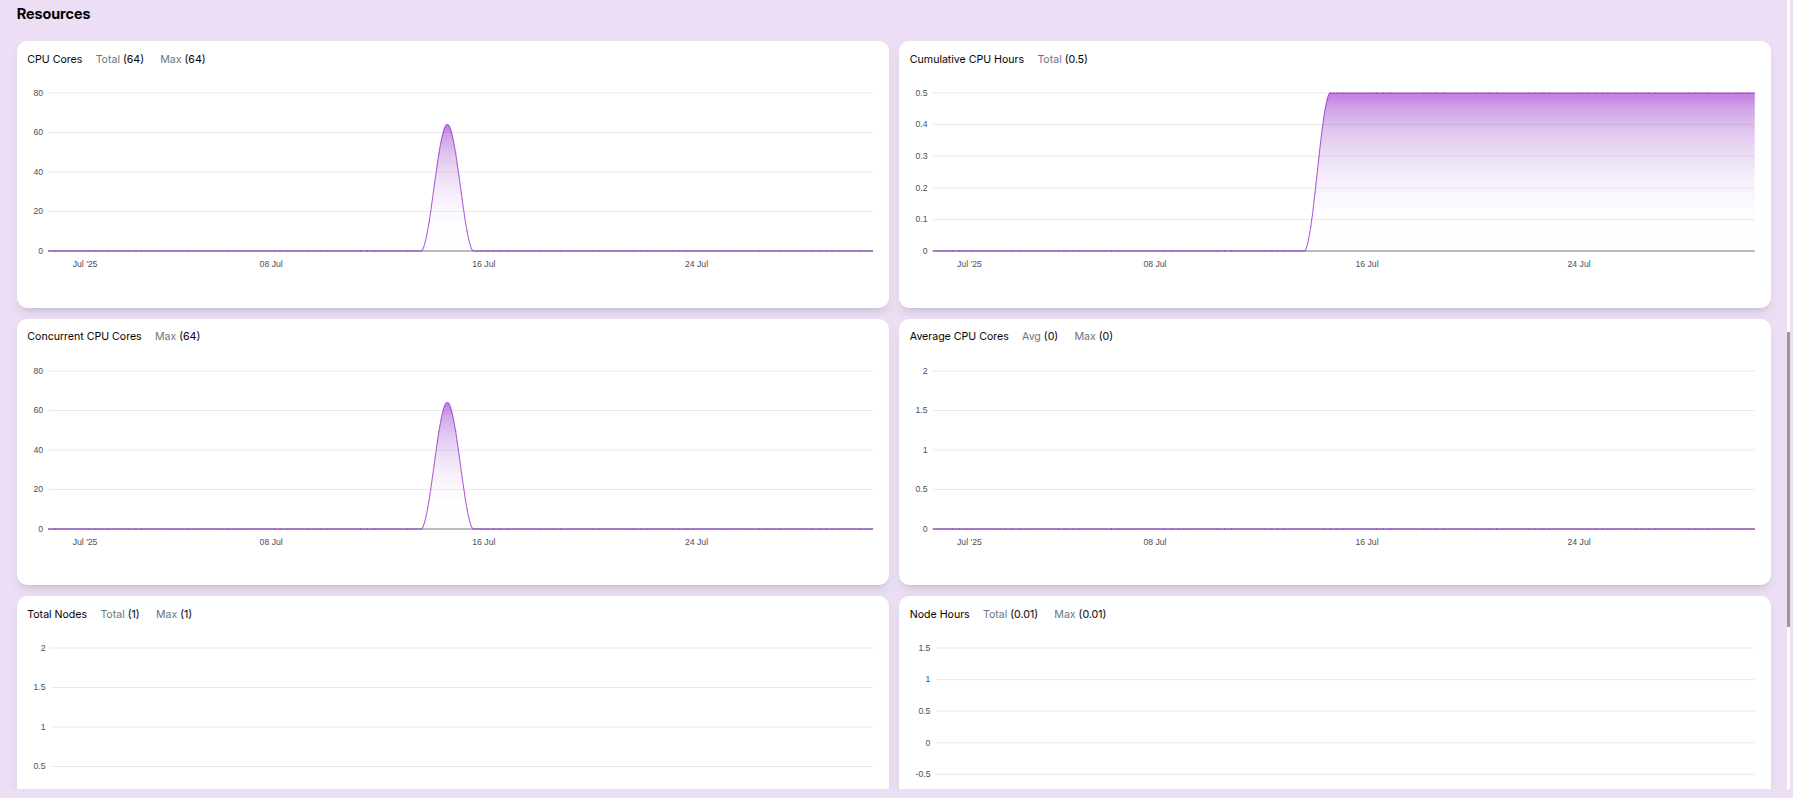
Resource Metrics:
- CPU cores usage: Helpful for tracking total capacity vs actual usage.
- Concurrent CPU cores: Useful for analyzing parallel job load.
- Cumulative CPU hours: Indicates total resource engagement.
- Average CPU usage: Shows average core usage over time.
- Total Nodes: Indicates the number of nodes provisioned.
- Node Hours: Highlights node utilization efficiency.
These metrics help users analyze both performance and cost at a glance.
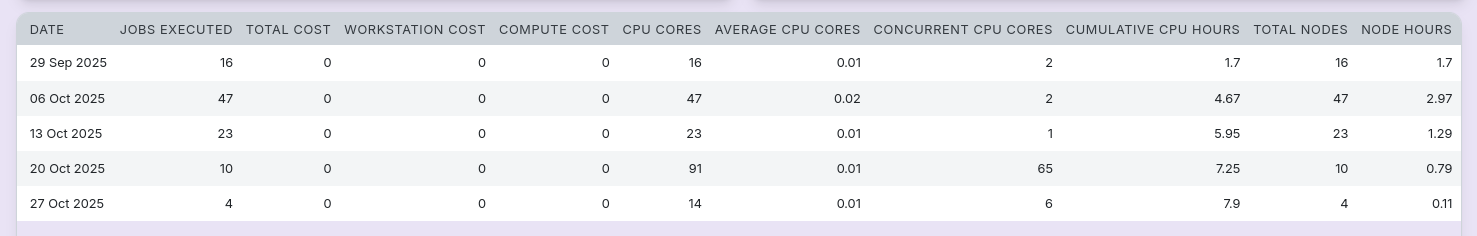
Computational Resource Report
This documentation provides a daily overview of job execution statistics, cost allocations, CPU metrics, and node utilization. It's designed to help teams monitor performance and optimize resource consumption.
Table View:
- Consolidated reports for the user are listed in this table, aggregated by monthly, daily, or weekly views.
This dashboard helps users monitor their resource consumption and job history across clusters in a visual format.
-
📌 General Notes
- If you encounter any UI issues or have questions about job submissions or status, please contact the Admin for support.
- Ensure you have selected the correct cluster, region, and provider when filtering Dashboard.