HPC Billing: Spendboard
Navigation Path
- HPC > Billing > Spendboard
Spendboard Overview
- Gives a real-time view of budgets, spends, and forecasts for each department.
- Allows switching between Budget, Spendboard, and Invoices using tabs at the top.
Department Selector (Left Side)
- Search and select from all available departments.
- Example departments:
- Research and Development
- Orgstgdept

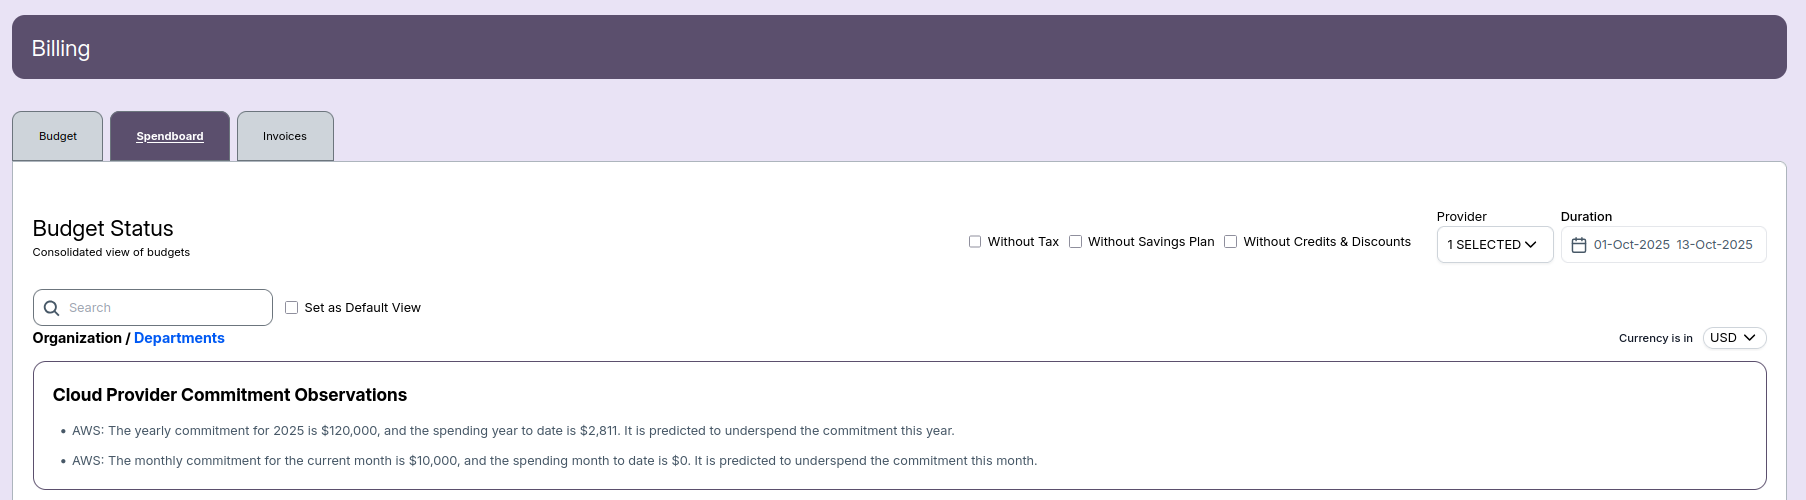
Spendboard Budget Status
- High-level view of organization/department budgets.
- Set as Default View checkbox to save preferred view.
- Provider and date filters to narrow data.
- Currency selection (e.g., USD).

Cloud Provider Commitment Observations
- Yearly commitment for providers (e.g., AWS $120,000/yr).
- Current year-to-date spend (e.g., $3,468).
- Monthly commitment (e.g., $10,000/month).
- Current month-to-date spend.
- System predicts under/over-spending against commitment.
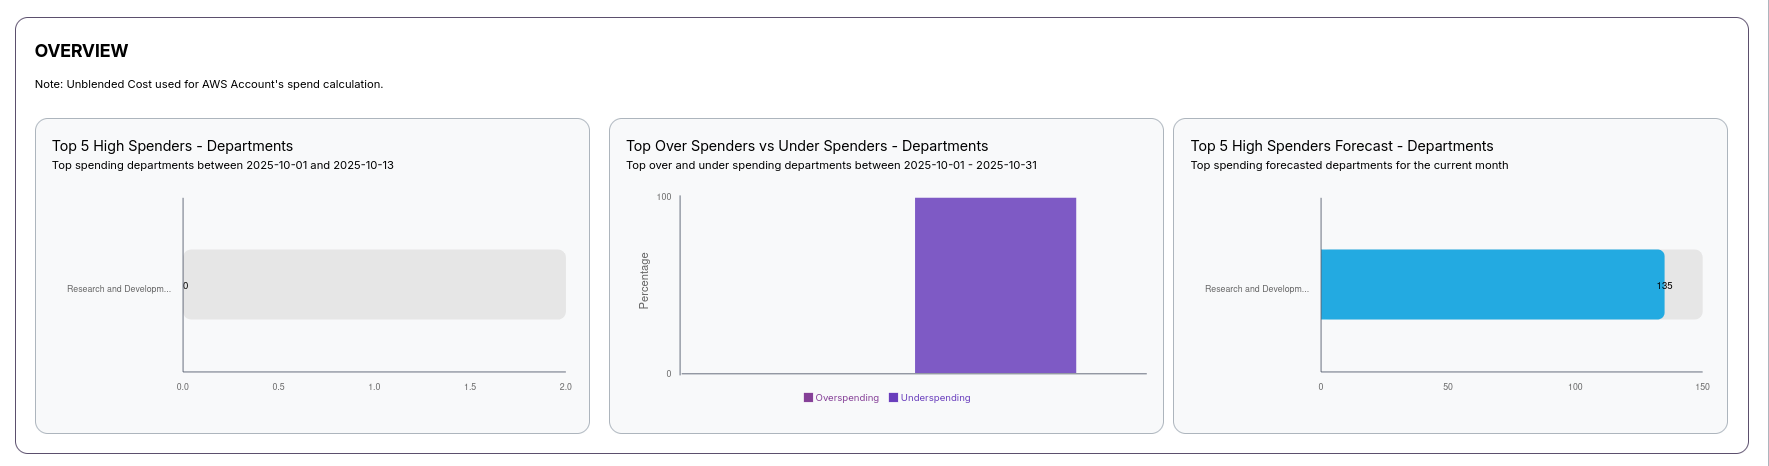
Graphical Department Overview
- Top 5 High Spenders: Bar graph showing which departments spent most in a given period.
- Top Over Spenders vs Under Spenders: Shows the ratio of departments over or under-spending.
- Top 5 High Spenders Forecast: Projects highest spending departments for the current month.
Central Spend Dashboard
Initiativewise Spend
- Shows total spend as a donut chart.
- The chart center displays the cumulative spend for the selected department.
- Visual representation gives a quick overview of how much has been spent.
- Useful for quick overview of cumulative department expenditure

Monthly Spend vs Commitment
- Bar graph with each bar representing the monthly spend vs. the planned commitment.
- X-axis: Months of the selected year.
- Y-axis: Spend and Commitment values.
- Allows tracking trends and identifying over/under-spending.
- Uses:
- Detect monthly spending trends
- Identify possible over/under budget periods
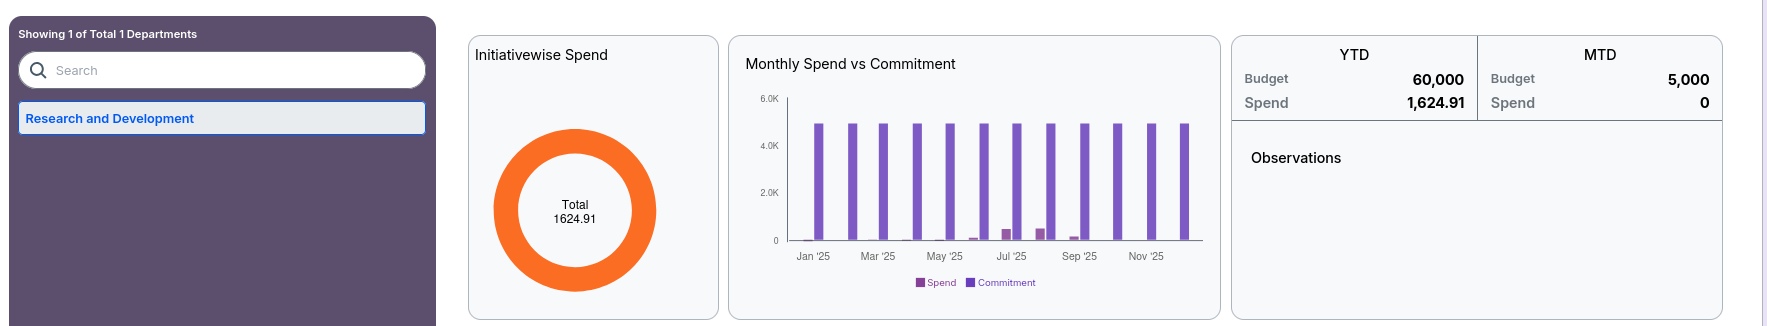
YTD & MTD Summary
- YTD (Year-to-Date)
- Budget: Total annual budget (e.g., 70,999.96)
- Spend: Spend accumulated up to today (e.g., 3,532.41)
- MTD (Month-to-Date)
- Budget: Current month’s budget (e.g., 6,033.33)
- Spend: Spend so far in the current month (e.g., 0)
- Observations section for important notes and trends.
- Comparison toggles: Previous Month, Previous Year

Budget vs Spending Table
- Shows spending summary for each month:
- Budget per month
- Total spend per month
- Forecast values if available
- Cloud provider breakdown (e.g., AWS):
- Usage
- Savings Plan Covered Usage
- Credit
- Tax
- Each field helps track budget vs. actual usage per month and provider.
- Extra columns for "Savings Plan Covered Usage" and "Credit" currently have no values.
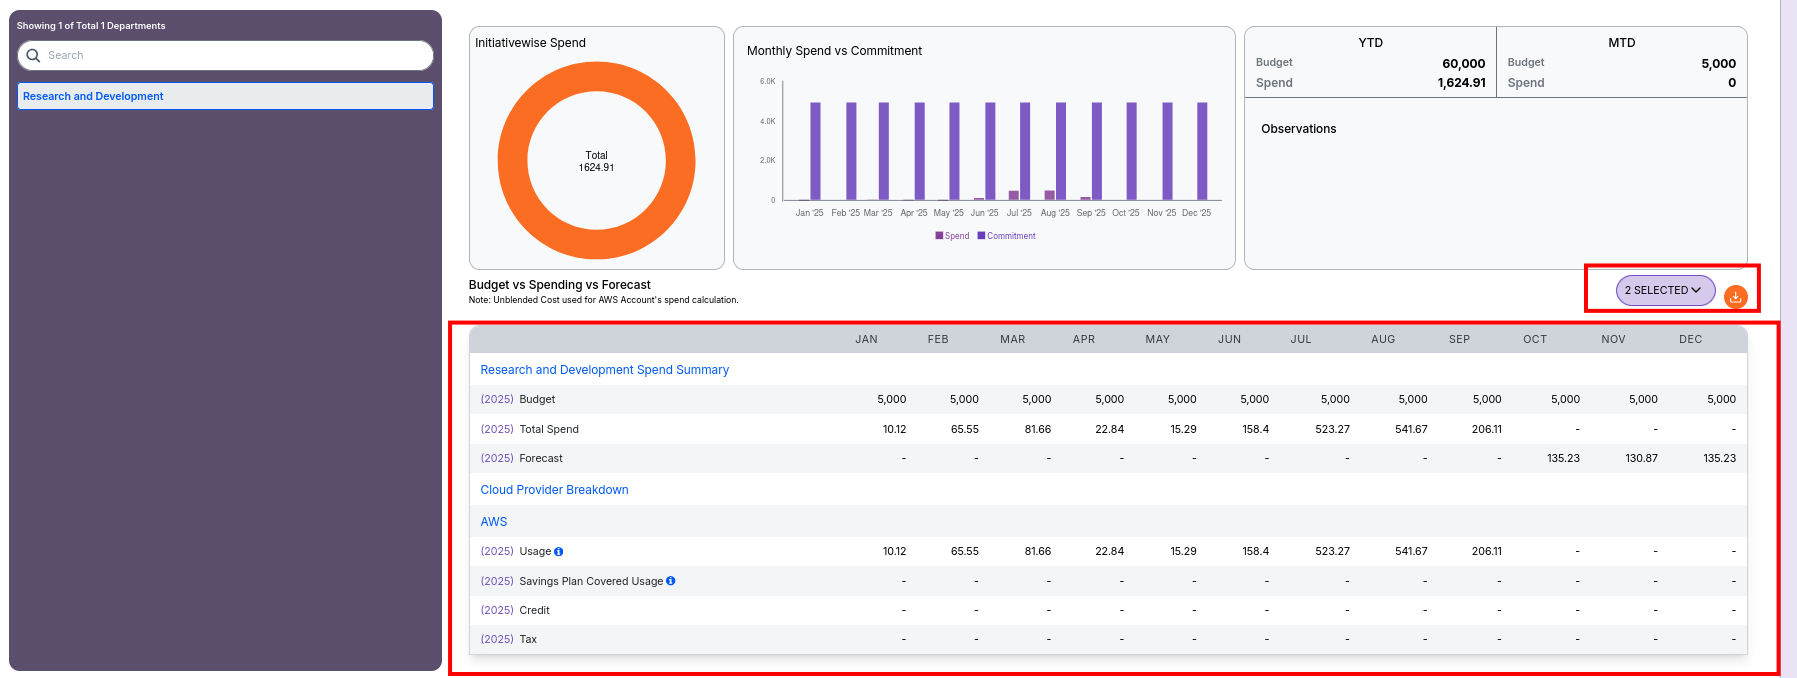
Dashboard Features
- Download button: Export current view reports
- Comparison selectors: Switch between previous month/year for trend analysis
- Interactive tables: View spend breakdown by provider and month
📌 Notes
- Unblended cost used for AWS spend calculations.
- Option to exclude tax, savings plans, and credits for more accurate analysis.