Observability
The Observability module provides a unified view of metrics, alerts, and events across your Cloud HPC platform resources — including clusters, queues, disks, and workstations.
It enables administrators and developers to analyze system health, track resource utilization, and troubleshoot performance or scaling issues from a single pane of glass.
1. How to Use This Dashboard
- Select the resource type (Cluster, Queue, Disk, or Workstation) from the sidebar.
- Use search and filtering options to quickly locate a specific instance, queue, or volume.
- View status, configuration details, live metrics, and alert history for each resource.

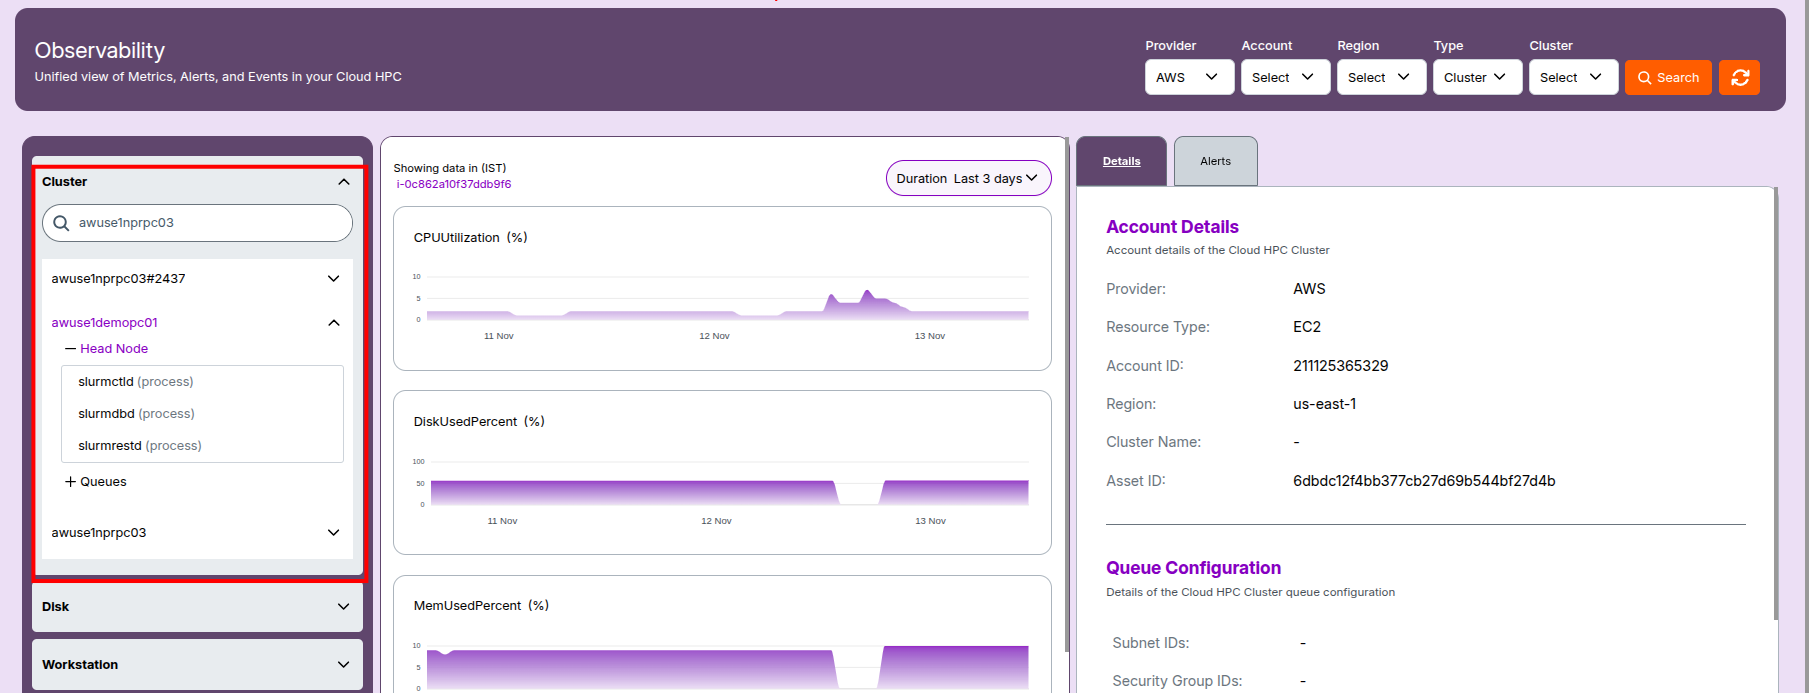
2. Cluster Observability
Overview
- Provider: Cloud vendor (e.g., AWS).
- Resource Type: Typically EC2 or ParallelCluster.
- Account ID / Region: Identifies where the cluster resides.
- Cluster Name: Unique name or ID for the cluster.
- Asset ID: Internal tracking identifier within your management system.
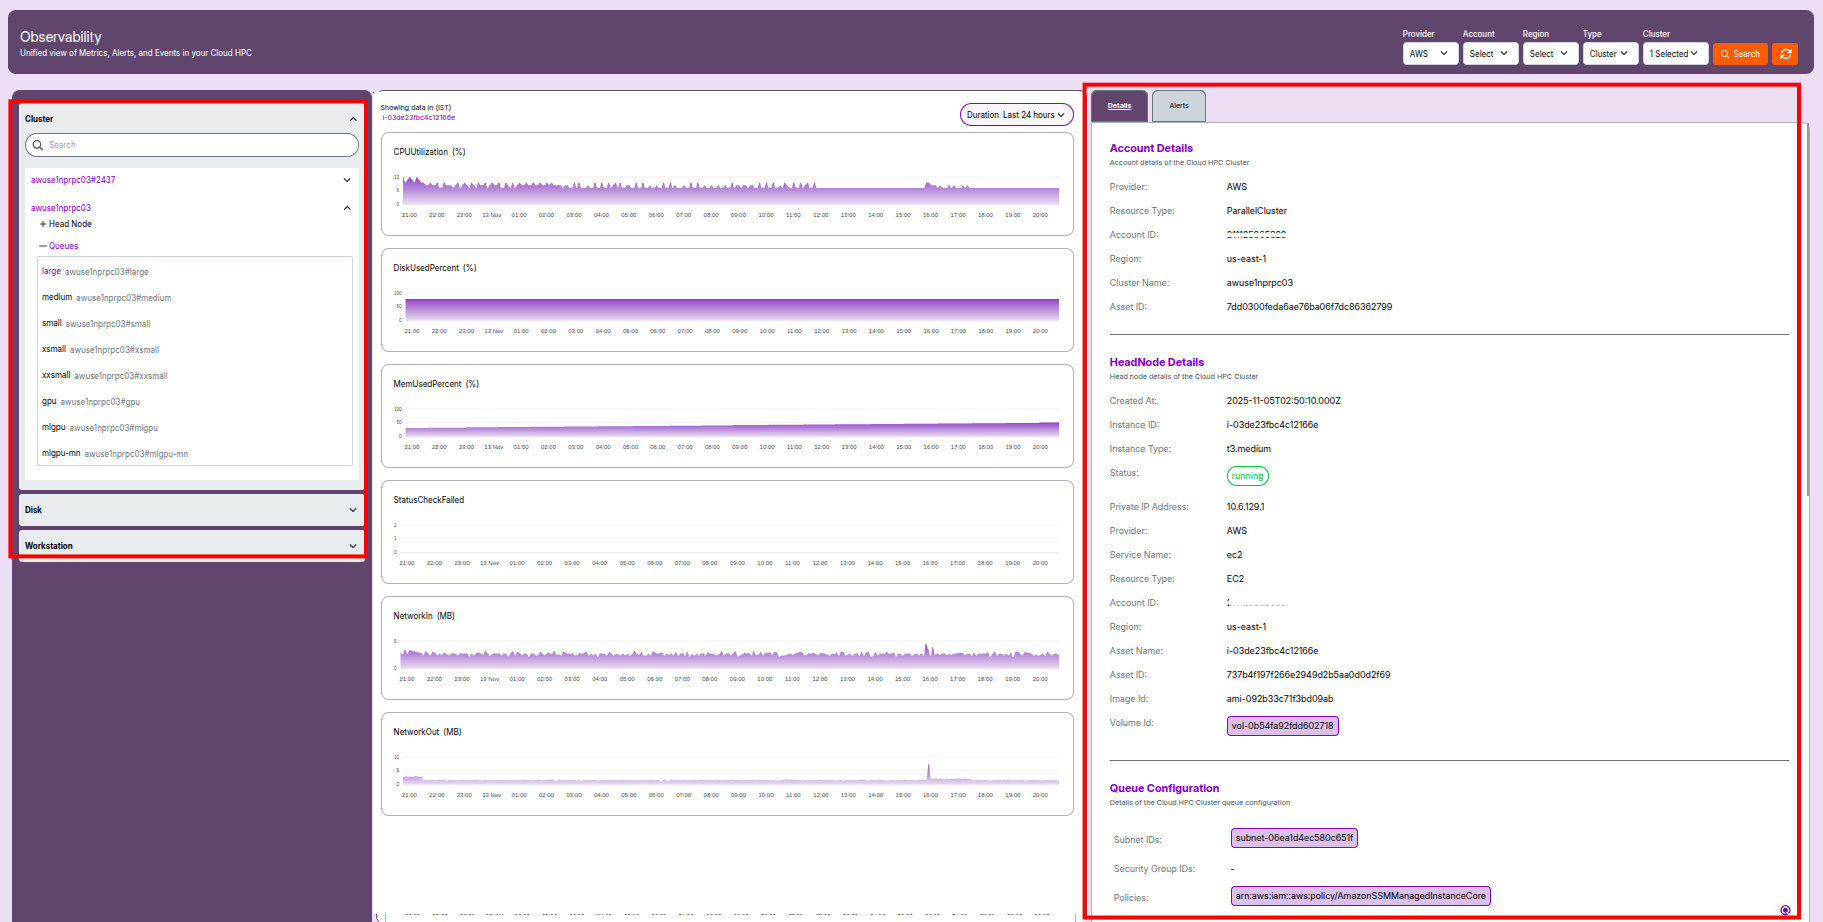
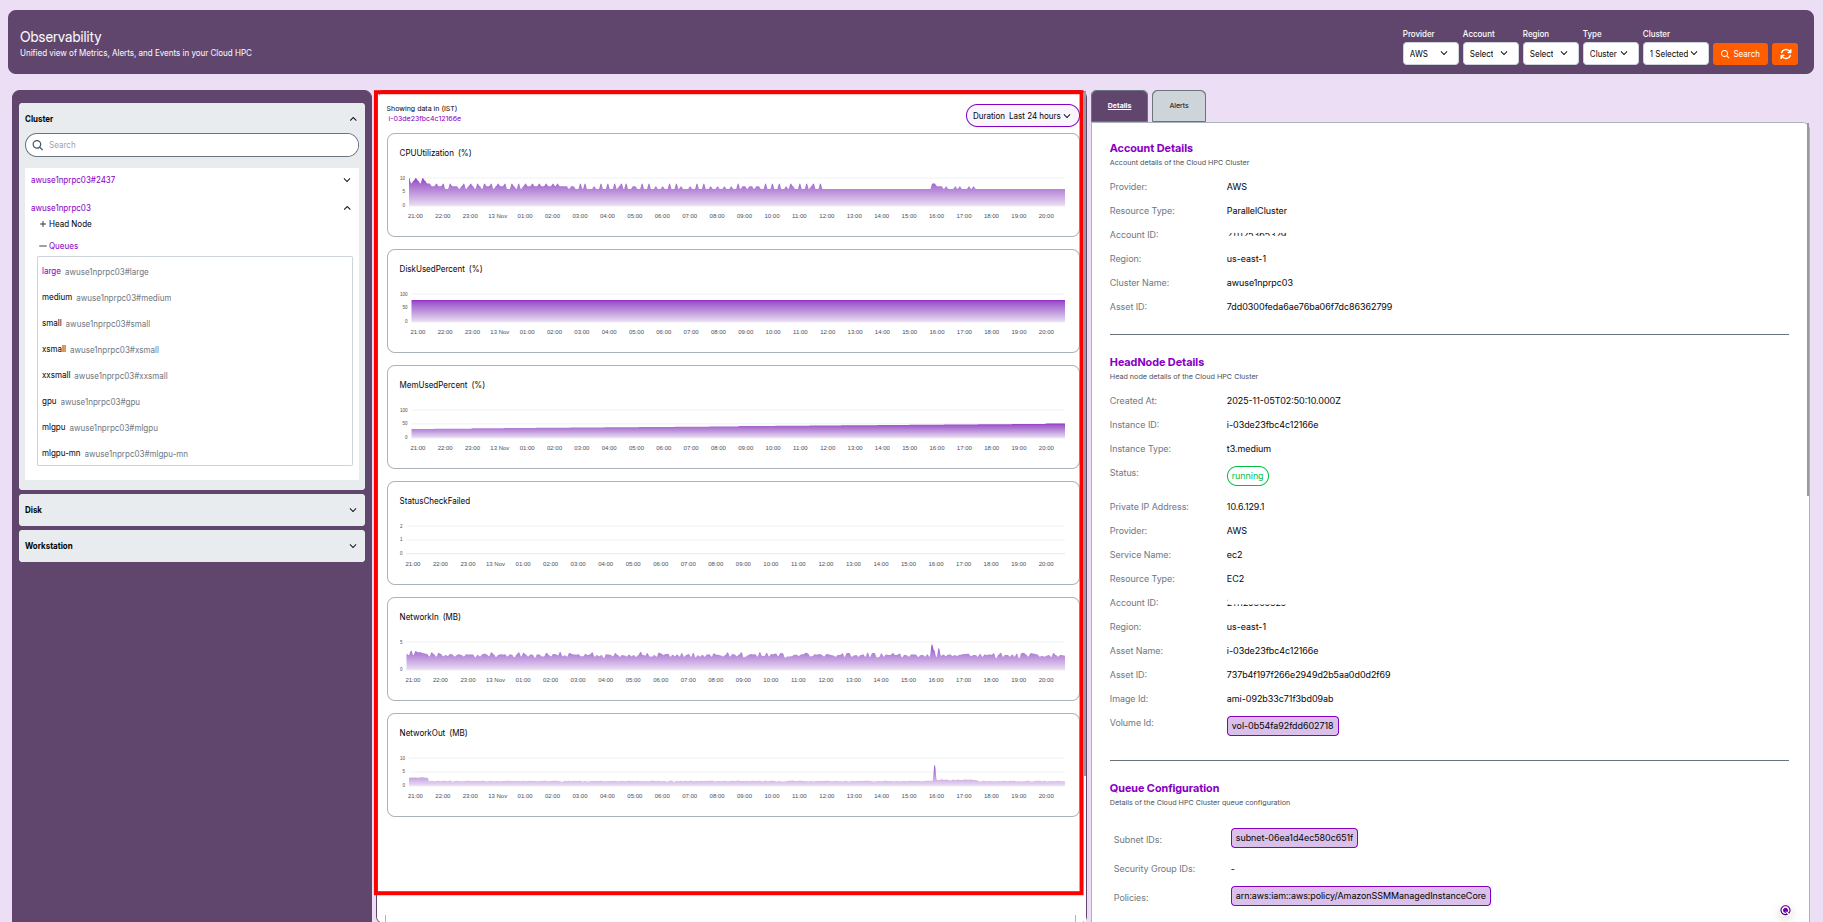
2.1 Head Node Details
- Provider: Indicates the cloud vendor hosting the head node (e.g., AWS).
- Resource Type: Shows
"ParallelCluster"for the overall cluster and"EC2"for the head node instance. - Account ID: AWS account that owns the cluster.
- Region: Geographic AWS region where the cluster is deployed (e.g.,
us-east-1). - Cluster Name: Unique identifier of the HPC cluster.
- Asset ID: Internal or cloud-mapped ID for tracking purposes.
- Created At: Timestamp indicating when the head node was provisioned (ISO or local time format).
- Instance ID: EC2 instance ID of the head node.
- Instance Type: AWS EC2 instance family/type (e.g.,
t3.medium). - Status: Real-time operational state (e.g.,
running,stopped). - Private IP Address: Internal network IP of the node.
- Service Name: Underlying infrastructure service (typically
ec2). - Asset Name: AWS EC2 instance ID or platform-generated name for the instance.
- Image ID: AMI used to boot the head node (includes OS and app base).
- Volume ID: EBS volume(s) attached to the instance, listed by ID.
-
💡 Insight
- The head node acts as the cluster’s control plane — managing job scheduling, monitoring, and communication with compute nodes. Any interruption to it can affect the entire workload queue.
Cluster Metrics
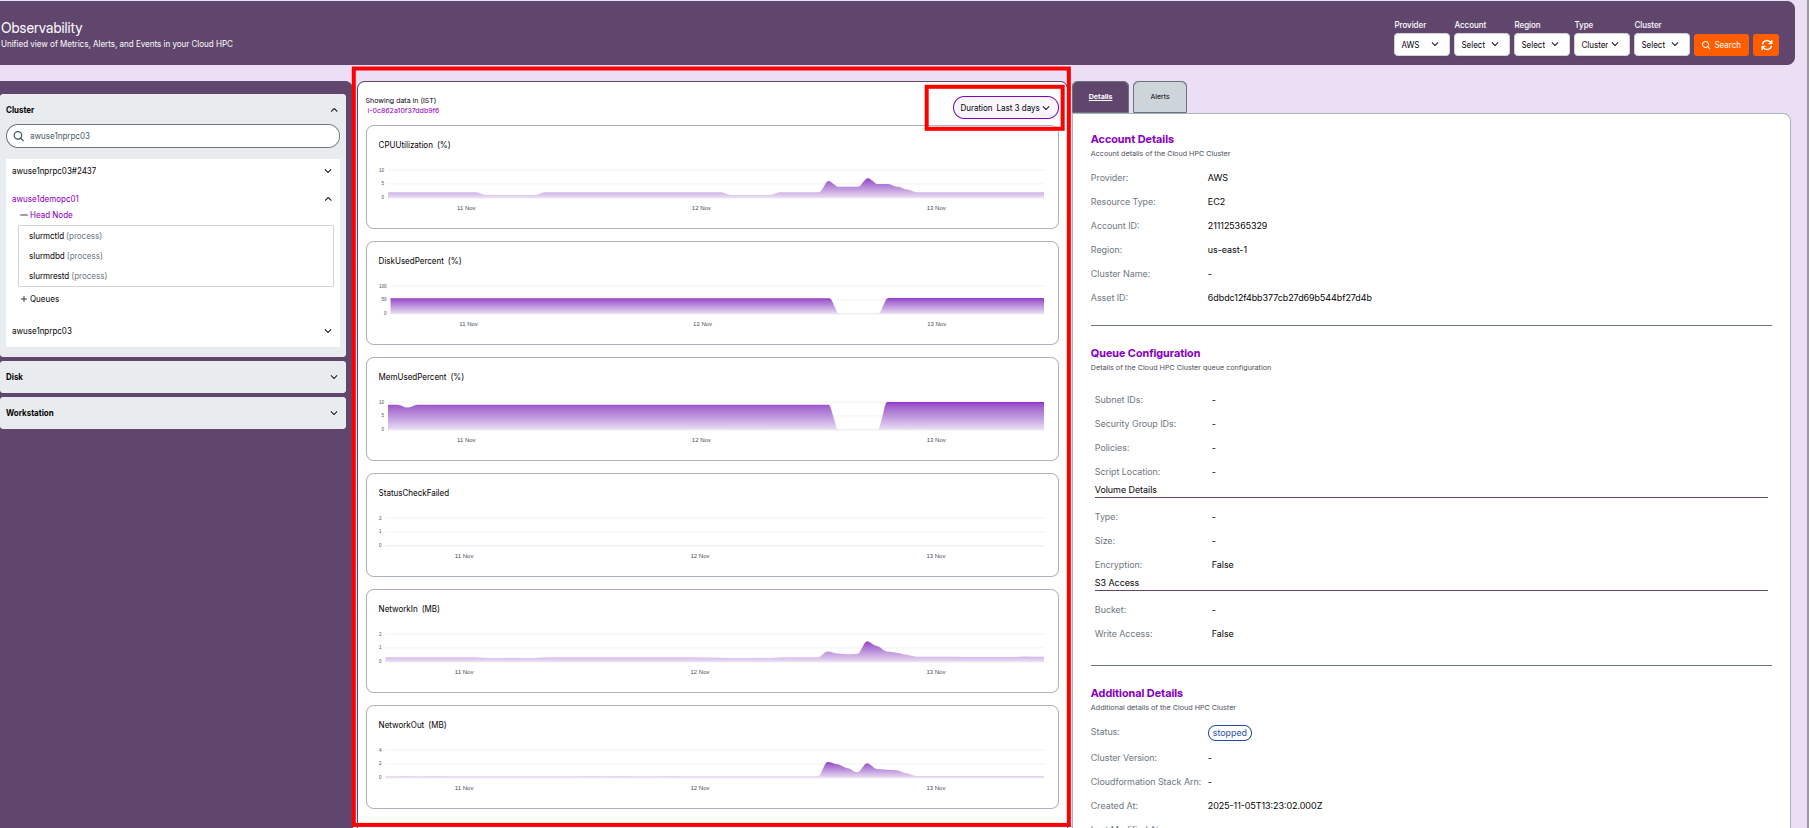
Metrics Panel
The Metrics Panel provides real-time and historical usage data for your selected resource — including cluster, queue, disk, or workstation.
It helps track resource health, identify performance bottlenecks, and support troubleshooting activities.
How to Use the Metrics Panel
Duration Selector
- Located on the top right (e.g., "Last 3 days").
- Allows you to choose the time window for visible metrics.
Timezone Indicator
- Displays the time standard for graphed data (usually IST).
- Ensures consistent comparison and troubleshooting across local and UTC times.
Key Metrics Displayed
CPUUtilization (%)
- Displays the percentage of CPU resources used over time.
- Peaks indicate heavy compute jobs or resource contention.
DiskUsedPercent (%)
- Shows the percentage of disk space currently used.
- High values (over 80–90%) should be monitored to prevent storage outages.
MemUsedPercent (%)
- Displays the percentage of system memory in use.
- Prolonged high memory usage can signal memory leaks or undersized resources.
StatusCheckFailed
- Counts failed instance health or status checks in the selected period.
- Any nonzero values require immediate investigation to ensure resource health.
NetworkIn (MB)
- Amount of incoming network traffic per period (in megabytes).
- Useful for identifying burst data uploads or distributed workloads.
NetworkOut (MB)
- Amount of outgoing network traffic per period (in megabytes).
- Spikes may indicate data exports, result delivery, or synchronization jobs.
Reading the Charts
- Each metric is visualized as a time-series line graph.
- Gaps or drops in the graph may signal downtime or monitoring misconfigurations.
- Sudden spikes or persistently high values are strong indicators that further investigation is required.
-
💡 Tip
- Use this panel regularly to compare performance trends and detect early signs of system stress or misconfiguration.
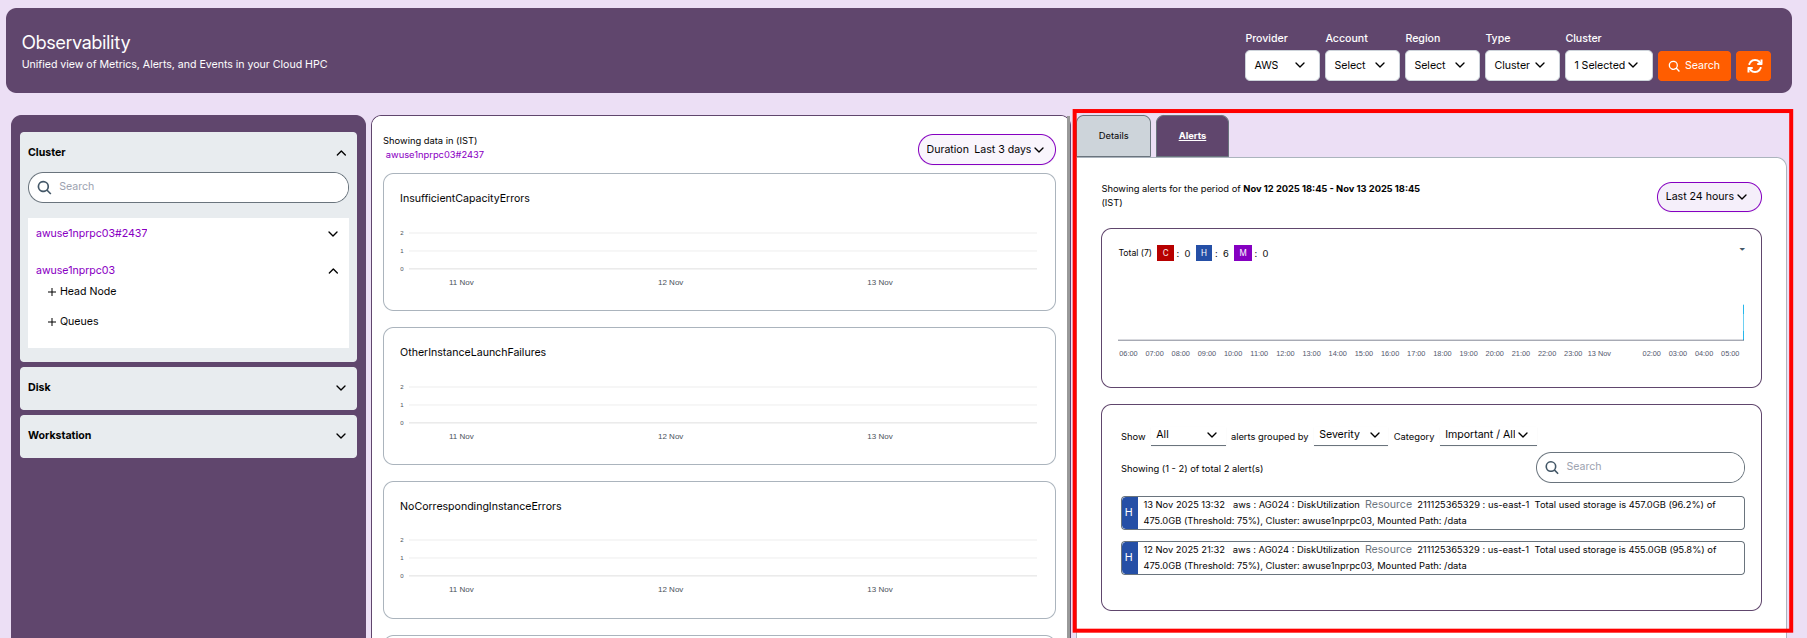
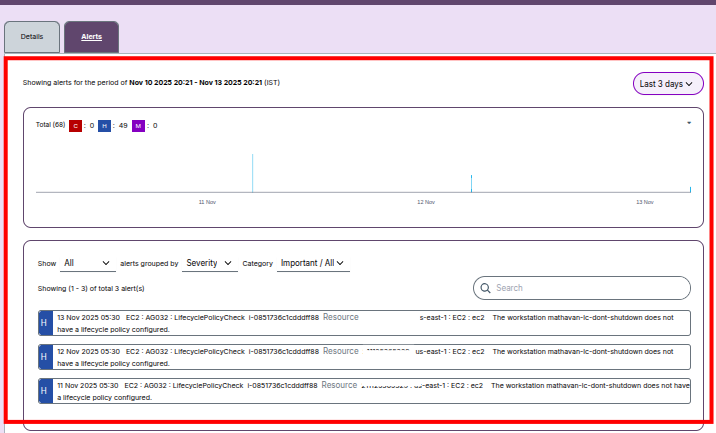
Cluster Alerts
- Alert Sources: Cluster-level alerts include failures, degraded node performance, or misconfigurations.
- Alert Examples:
Critical:Head node unreachable or failed initialization.High:CPU utilization above defined thresholds.Medium:Disk latency or memory usage warnings.
- Monitoring Tools: These alerts are visible in the Alerts Menu under Cluster category.
- Action: Click an alert to view timestamp, severity, and related AWS resource IDs.
2.2 Queue Observability
Queue Configuration
- Queue Configuration: Logical grouping for running compute jobs within the cluster.
- Subnet IDs: Network subnets where queue nodes are launched (defines AZ and network isolation).
- Security Group IDs: Security groups applied to queue nodes (firewall rules).
- Policies: IAM roles/policies that grant nodes permission to access AWS resources (e.g., SSM).
- Script Location: S3 URI pointing to initialization scripts for queue nodes.
Volume Details
- Type: Storage class (e.g.,
gp3for high-performance SSD). - Size: Disk size in GB.
- Encryption: Indicates whether encryption is enabled (
True/False).
S3 Access
- Bucket: S3 bucket configured for data access (may be blank if not set).
- Write Access:
Trueif queue nodes have write permissions; otherwiseFalse.
Compute Resources
- Name: Logical compute group (e.g.,
xsmall,medium). - Instance Type: Instance family and vCPU count (e.g.,
c6i.4xlarge). - Min/Max Instance Count: Defines autoscaling boundaries for the queue.
- EFA Enabled:
Trueif Elastic Fabric Adapter networking is enabled for low latency. - Placement Group Enabled: Indicates whether nodes are grouped for network optimization.
- Disable Simultaneous Multithreading: Disables vCPU hyper-threading for better single-core performance when set to
True.
Additional Details
- Status: Overall cluster or queue state (e.g.,
up,down). - Cluster Version: Version of AWS ParallelCluster deployed.
- CloudFormation Stack ARN: Identifier for the deployment stack (optional).
- Created At / Last Modified At: Timestamps for tracking configuration changes.
- Compute Fleet Status: Current state of the scheduler or compute fleet (e.g.,
active,on demand). - Tags: Key-value pairs used for grouping, billing, or automation (e.g.,
node-type,project-environment).
Queue Metrics and Graphs
- Live Metrics: Displays queue activity — allocated, idle, and failed nodes.
- Graph Data: Lines represent load, scaling behavior, and utilization trends.
Queue Alerts
- Alert Types:
Critical:Queue scaling failure or scheduler crash.High:Spot instance interruptions.Medium:Job pending or policy misconfiguration.
- Alert Actions:
- Use severity filters to isolate specific queue issues.
- Timeline view highlights bursts of queue errors.
- Screenshot: Insert queue metrics and alert view for visual context.
-
💡 Tip
- Consistently monitor queue scaling trends — unexpected node counts or prolonged idle states may signal misconfigured autoscaling or insufficient IAM permissions.
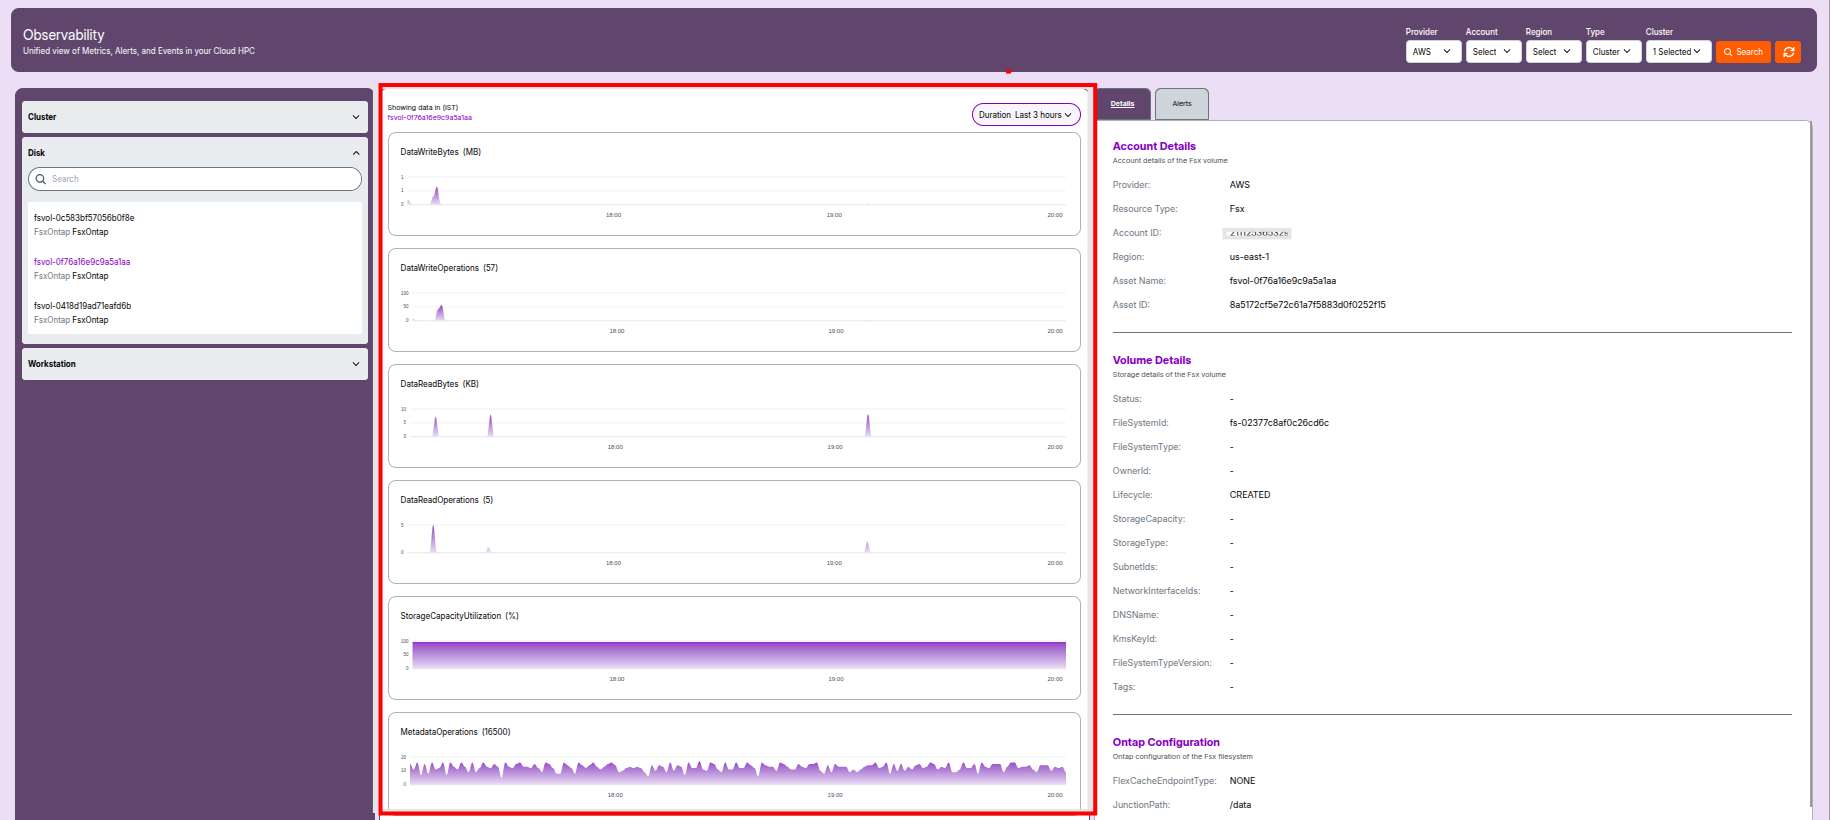
3. Disk Observability
Disk Overview
- Provider: Cloud service provider (e.g., AWS).
- Resource Type: Storage service type (e.g.,
"ElasticFileSystem"for EFS). - Account ID: Owner account responsible for billing and access.
- Region: AWS region where the disk resides.
- Asset Name / ID: Identifiers for the EFS or FSx resource.
- Status: State of the file system (e.g.,
available,degraded). - File System Name: User-assigned or automatically generated name.
- FileSystemArn: Complete Amazon Resource Name (ARN) for the EFS volume.
- File System Owner ID: AWS account ID that created the file system.
- File System Creation Token: Secure token used during provisioning.
- File System KMS Key ID: Key ARN for encrypting data at rest (if enabled).
- Created At: Date and time when the file system was created.
- File System Performance Mode: Defines performance class (e.g.,
generalPurpose). - File System Encrypted:
Trueif encrypted at rest. - File System Throughput Mode: Throughput mode (e.g.,
bursting,provisioned). - Tags: Metadata used for identification and automation (e.g., project name, environment).
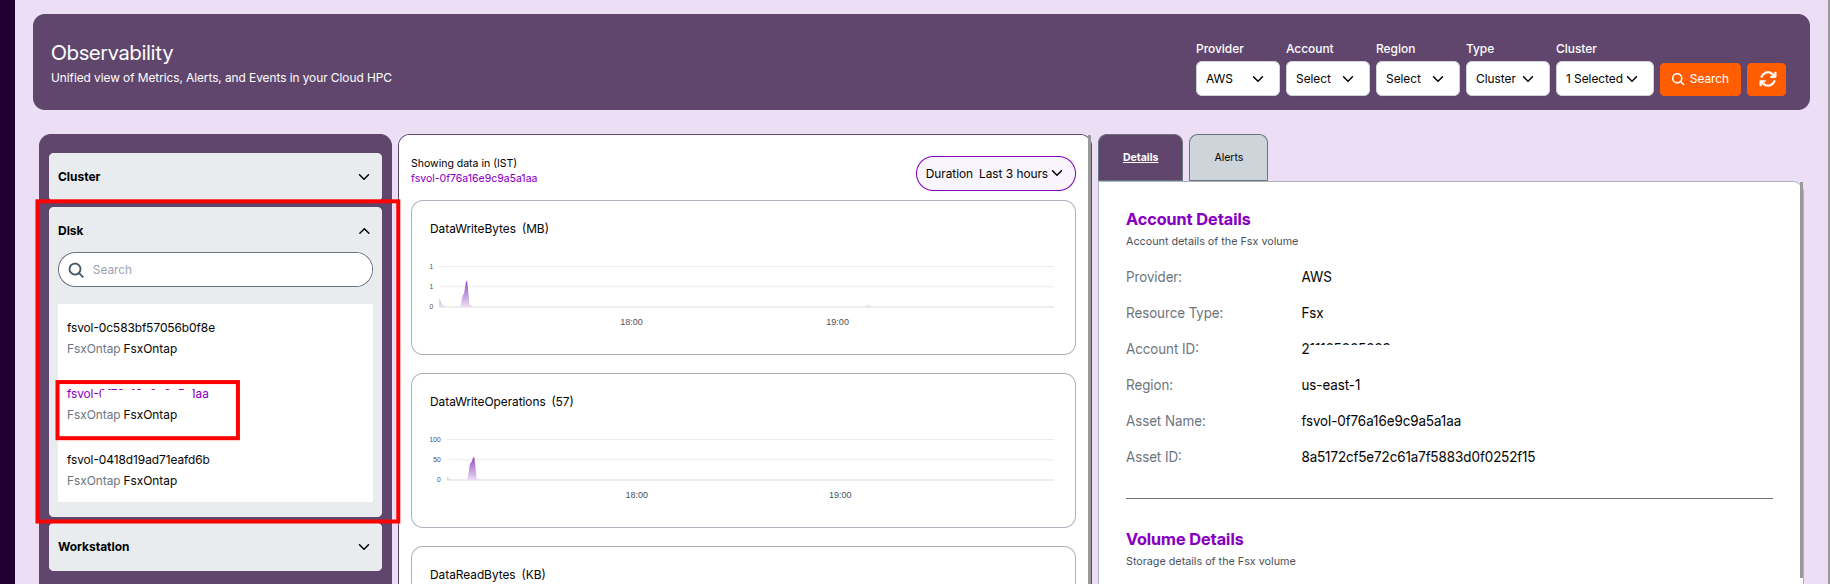
Disk Metrics and Graphs
- Storage Utilization: Graphs showing reads/writes, capacity, and latency.
- Performance History: Track throughput spikes or performance degradation.
Disk Alerts
- Alert Types:
Critical:Filesystem degraded or unavailable.High:I/O saturation or mount errors.Medium:Capacity nearing threshold.
- Alert Data Fields: Include timestamp, source, affected resource, and message text.
- Recommended Actions:
- Expand capacity or tune performance mode.
- Check KMS encryption status for failures.
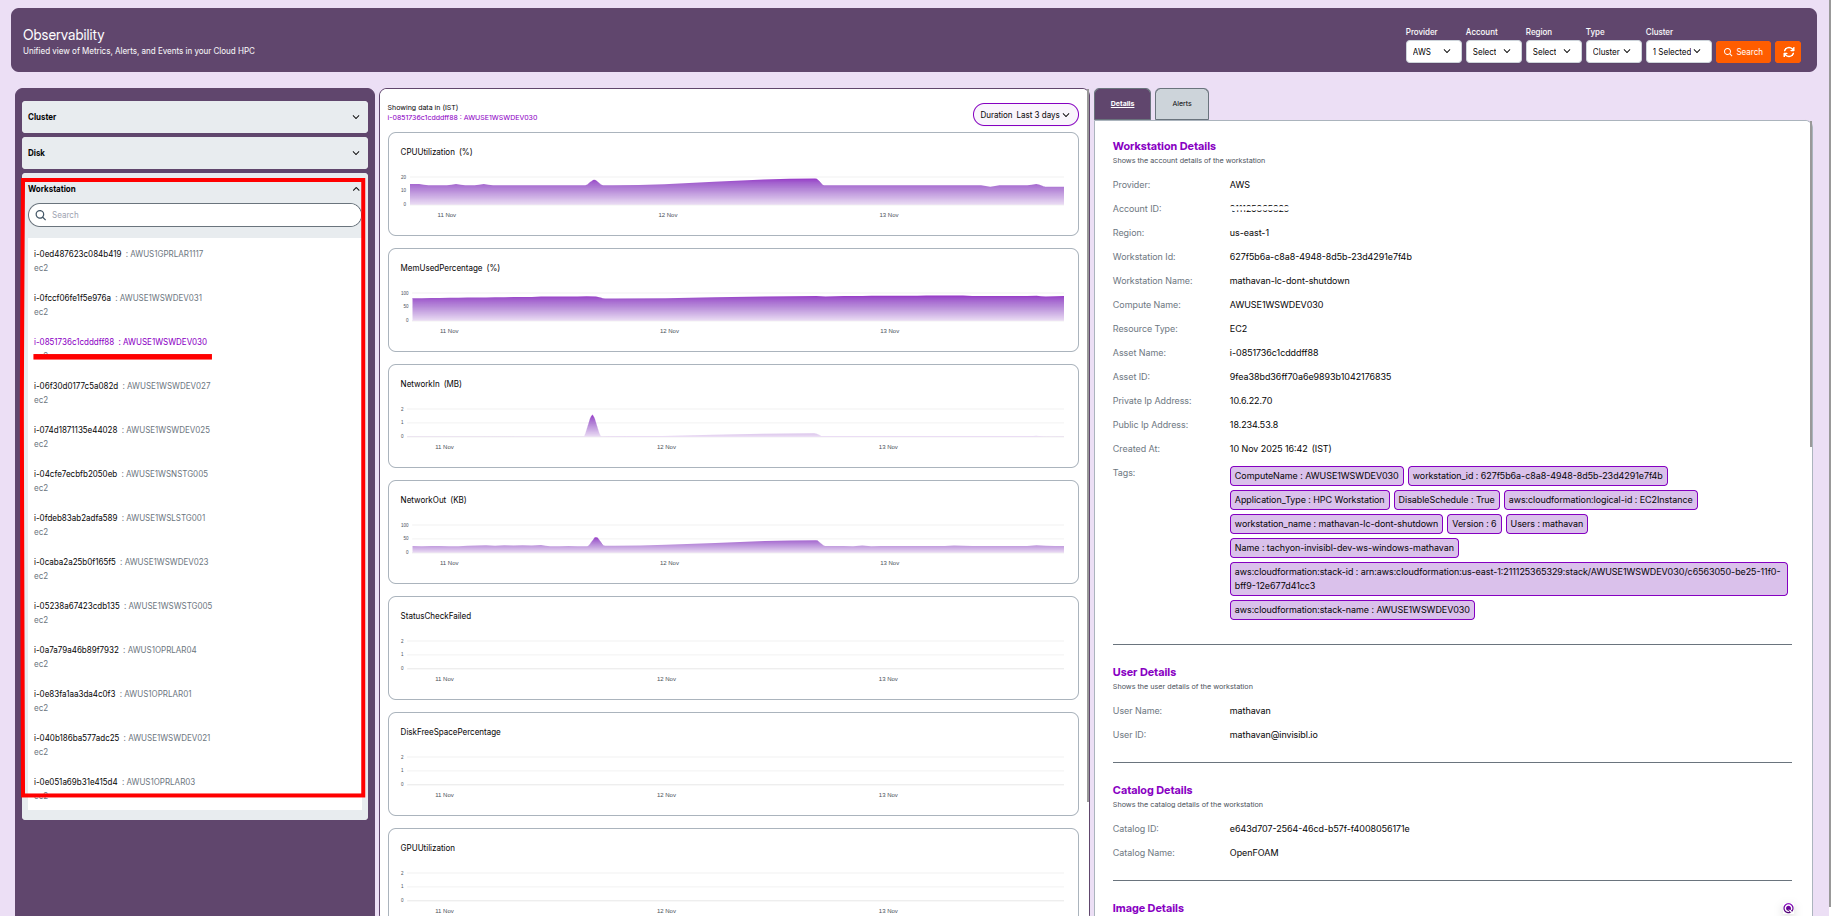
4. Workstation Observability
Workstation Overview
- Provider: AWS or other cloud vendor.
- Account ID / Region: Location and ownership details.
- Workstation ID / Name: Unique identifiers.
- Compute Name: Node group association.
- Resource Type: EC2 or equivalent compute.
- Asset Name / Asset ID: Instance identifiers.
- Private/Public IP: Network endpoints.
- Created At: Launch date and time.
- Tags: Key-value pairs for management and automation.
- User Details: Assigned user name and ID.
- Catalog & Image: Source image details and OS.
- Volume Details: Storage info, size, and status.
- Capacity Details: vCPUs, RAM, and cost details.
- Network & Security: Subnet, VPC, SGs, IAM roles.
- Stack Details: CloudFormation metadata.
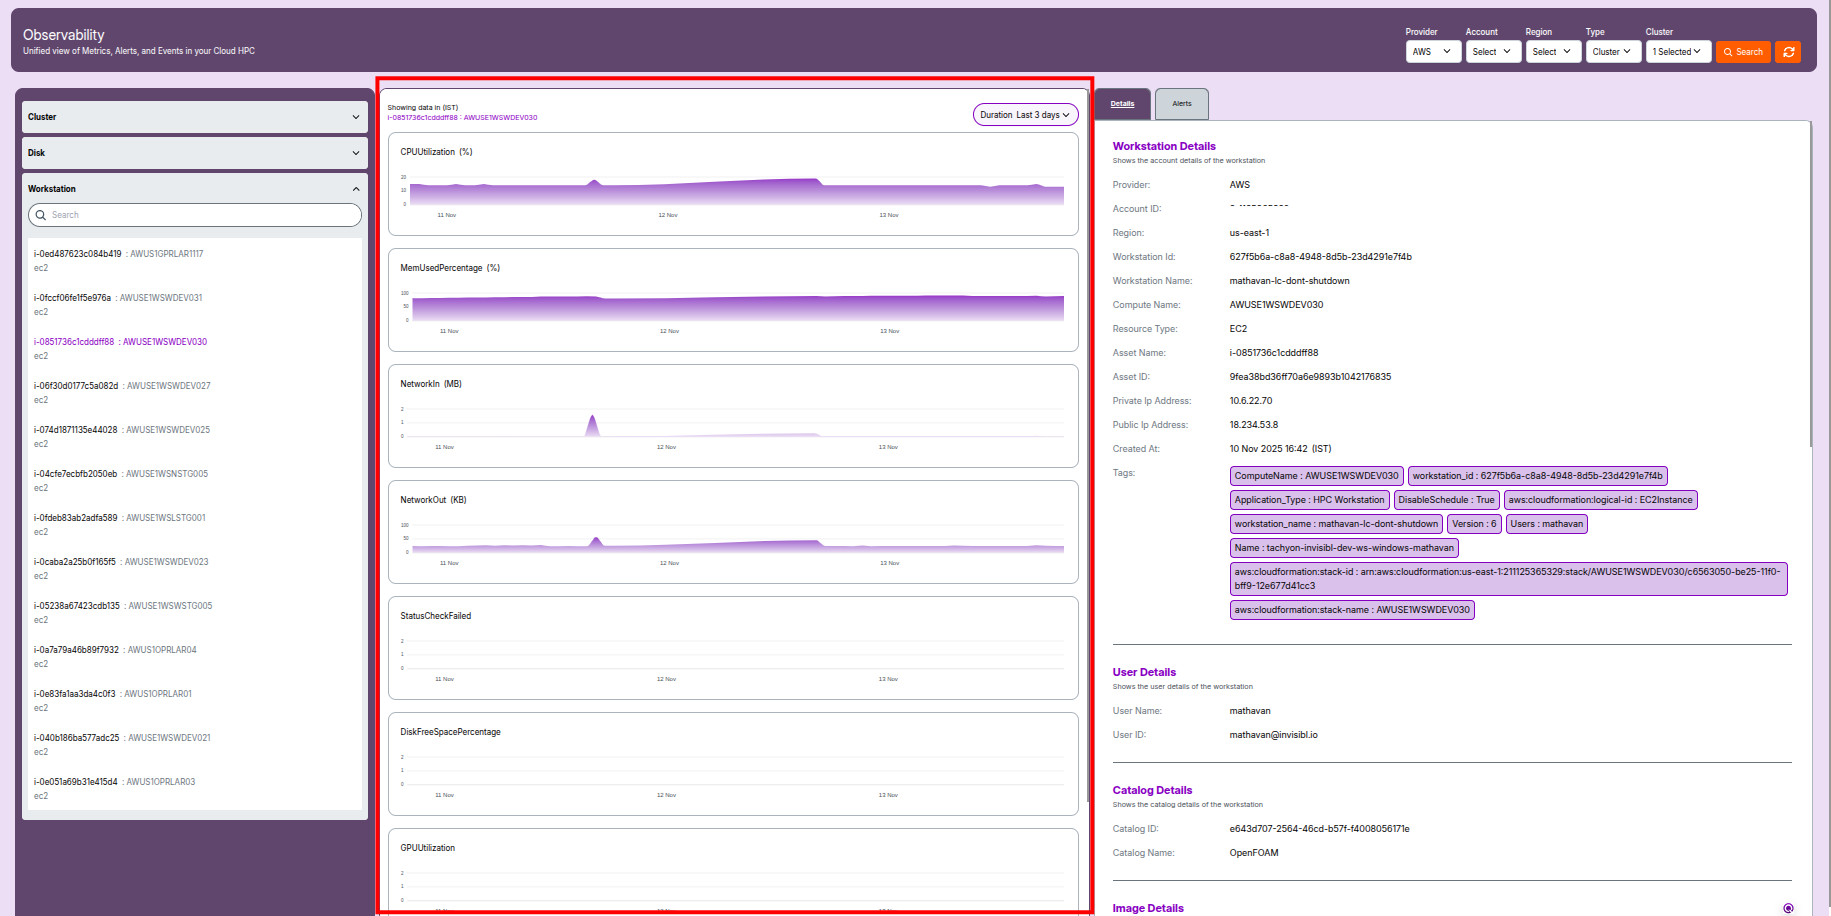
Workstation Metrics and Graphs
- System Health: Displays CPU, RAM, and network usage over time.
- Performance Trends: Identify underutilized or overused compute.
- Visuals: Add screenshot of workstation monitoring page.
Workstation Alerts
- Alert Types:
Critical:Workstation unresponsive or failed to initialize.High:High CPU/memory utilization or network failure.Medium:Missing IAM role or outdated image.
- Alert Features:
- Each alert displays timestamp, resource name, and impact severity.
- Use search and filters to quickly isolate workstation-specific alerts.
-
💡 Key Points:
- Alerts are generated from real-time metrics and threshold events.
- Filtering and search make diagnosis faster.
- Timeline visualization helps detect recurring issues.
- Alerts support trend analysis, capacity planning, and incident response.
-
💡 Notes:
- All values and keys are sourced from the actual Observability Dashboard.
- Each bullet explains what the field represents and its operational importance.
- Structure is uniform across all sections for maintainability.