Consolidated Cost
The Consolidated Budget and Spend Cost Report provides a unified overview of spend costs across all key dimensions including Cluster, Queue, User, Project and Job for a selected reporting period. Instead of viewing costs in isolation, this report brings together multiple perspectives into a single view, enabling administrators, project managers, and finance teams to understand overall consumption patterns and cost drivers. By consolidating data from different levels, it supports cross-comparison, highlights anomalies, and helps in identifying areas where resources are being over-utilized or underutilized.
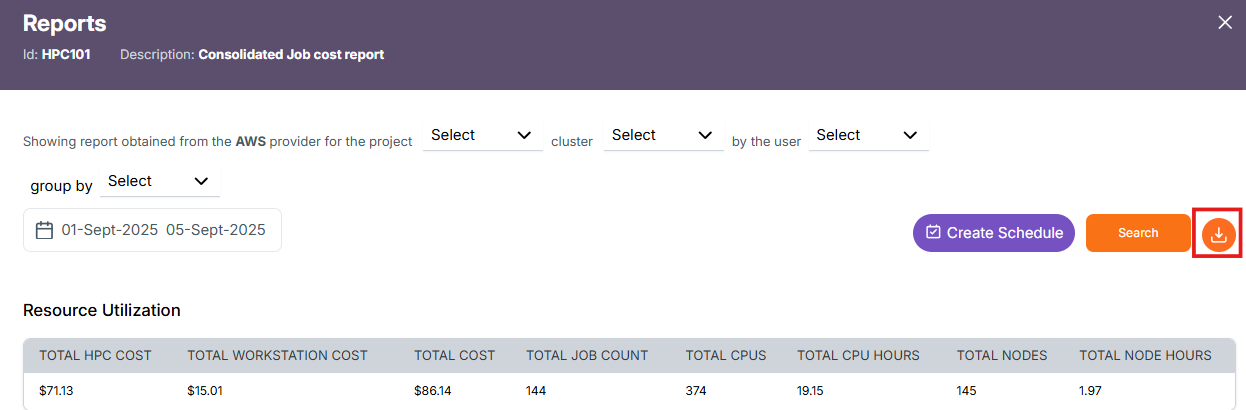
HPC101 – Consolidated Job Cost Report
The Consolidated Job Cost Report provides a comprehensive view of spend costs associated with all jobs executed in the HPC environment during a given reporting period. Unlike individual job-level reports, this consolidated version aggregates cost information across multiple jobs, enabling trend analysis, workload comparison, and overall visibility into job-related expenditures.
Filters Available and Usage
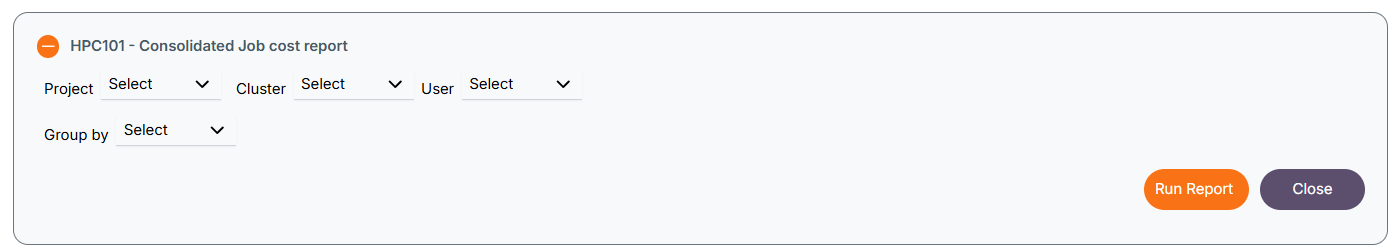 The following filters are available:
- Project – e.g., HPC, Tachyon.
- Cluster – Compute cluster to analyze.
- User - User who ran the job.
- Group By – used to group data by project, cluster or user.
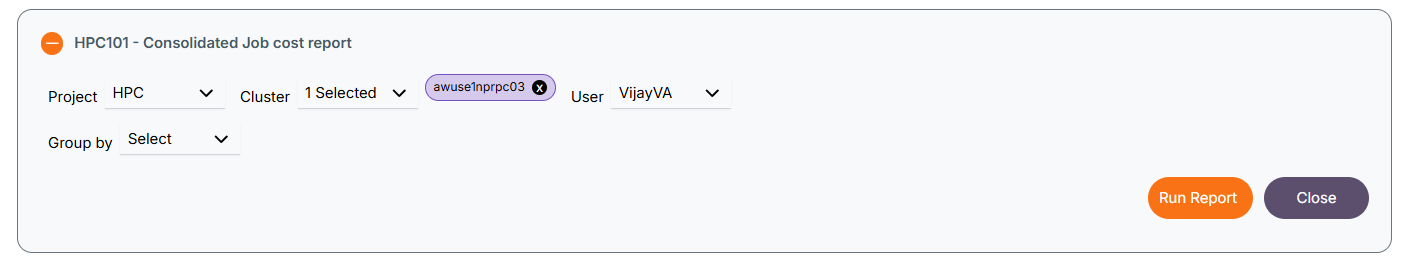
When one or more filters are selected, the report displays data accordingly based on the selected Project, Cluster, or User.
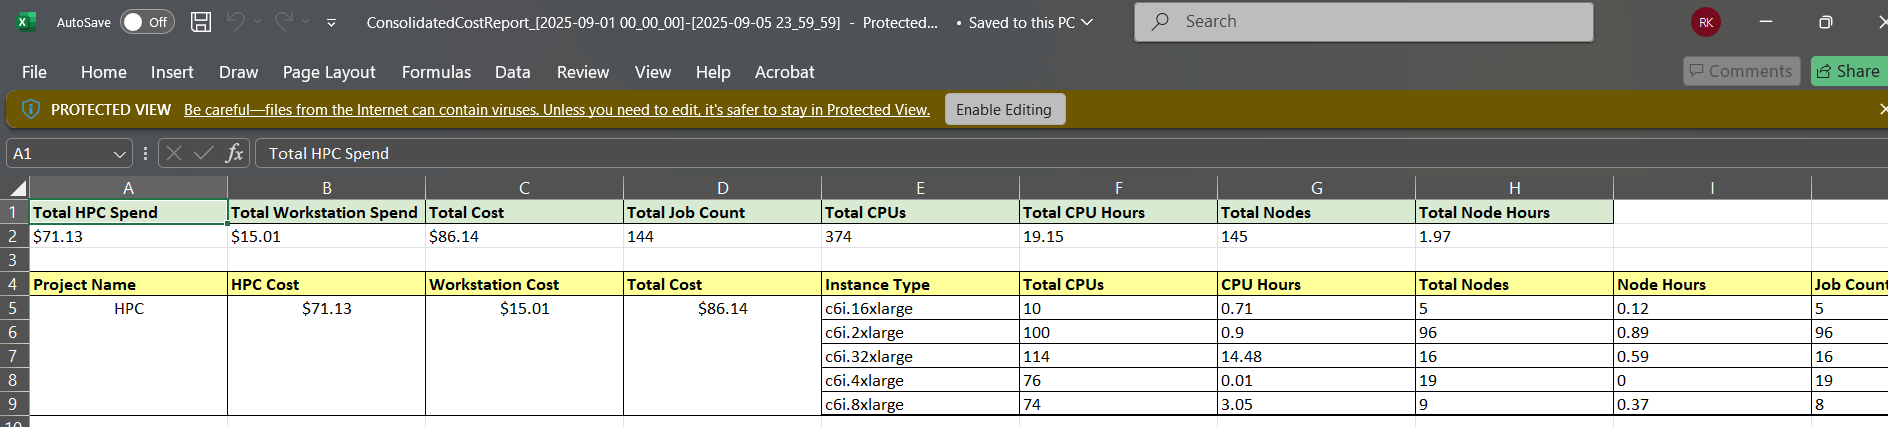
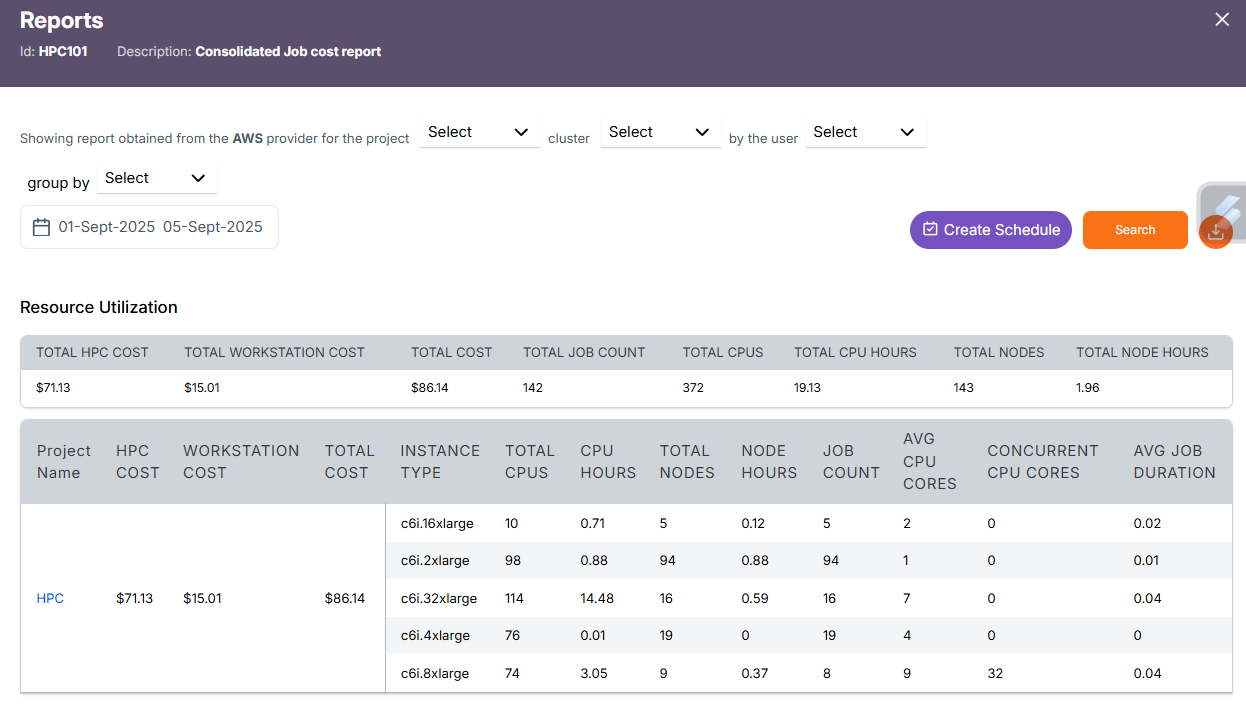
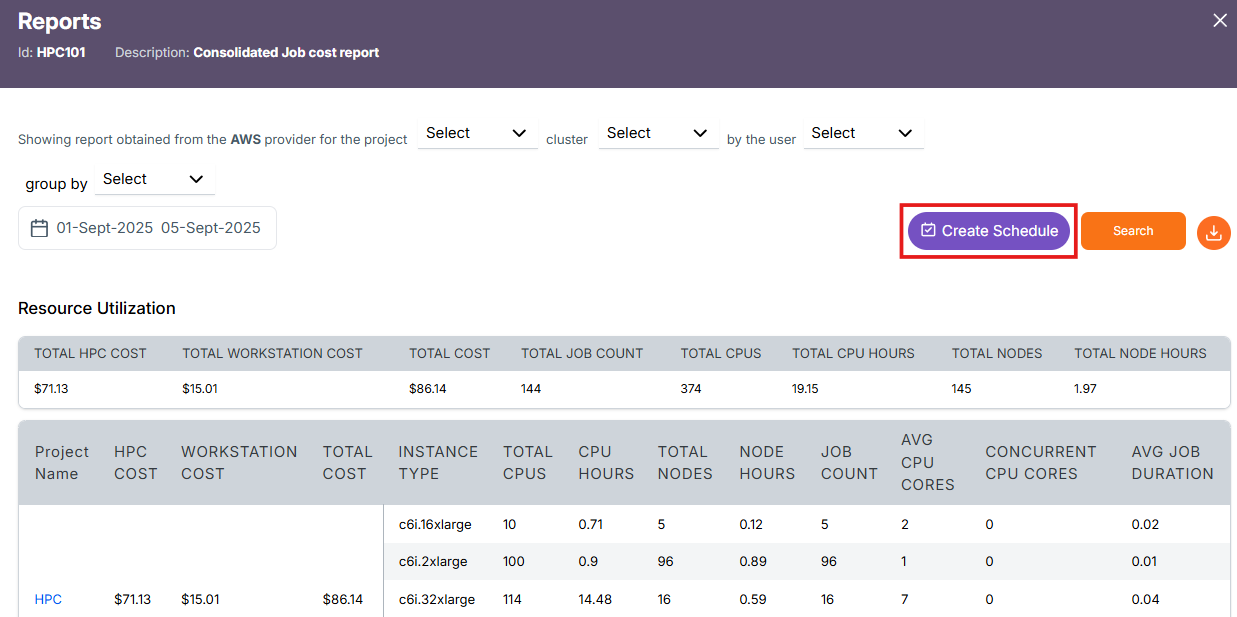
Clicking the Run Report button without selecting any filters will generate full data without any filtering. The structure will look as shown below:
When one or more filters are selected, the report displays data accordingly based on the selected Project, Account, Region, Cluster, Queue, or User. Additionally, the Group by option organizes the results based on the chosen grouping criteria.
Project Level Report
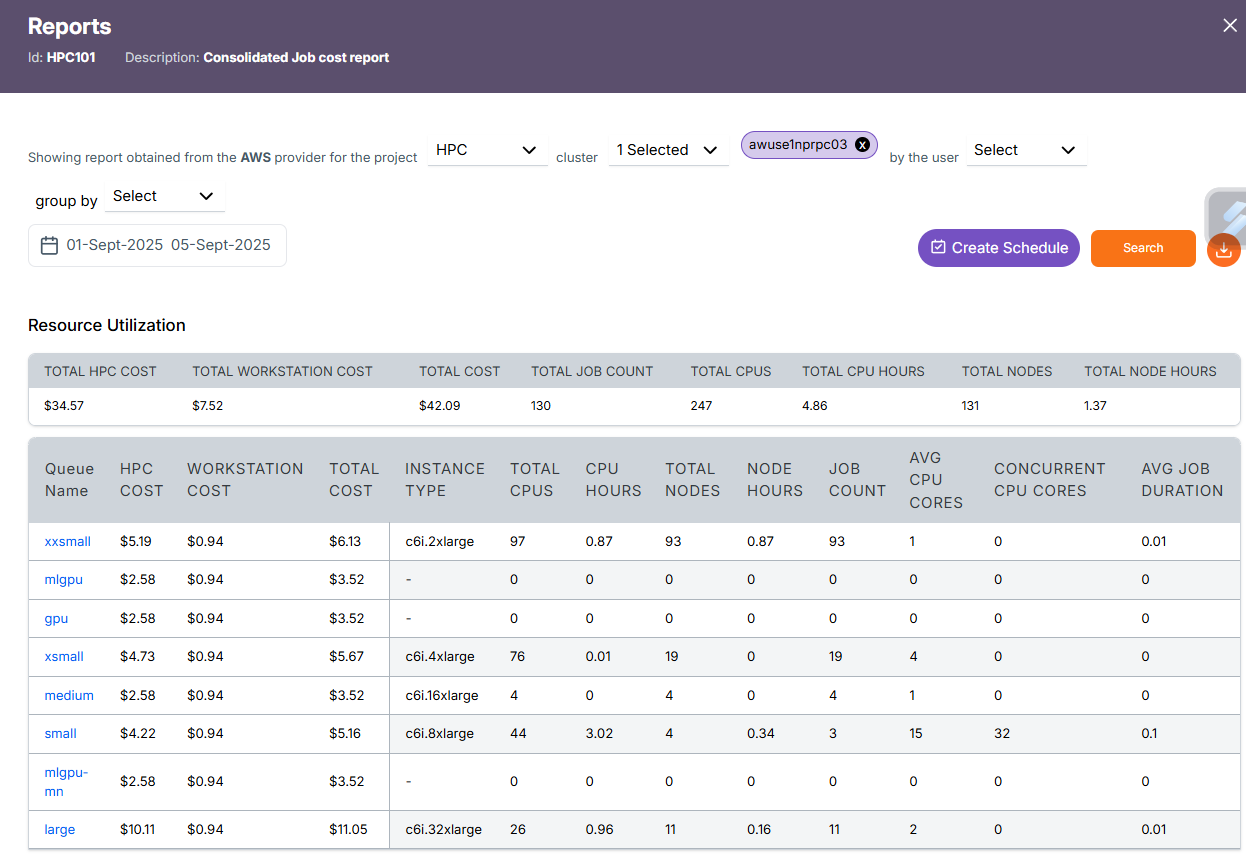
By clicking the Run Report button without selecting any filters, the report will be generated at the Project level. You can then drill down further into Cluster → Queue → User → Job by clicking on the respective project.
The table contains:
- Project Name- Name of the project associated with the costs and resource usage.
- HPC Cost: Total cost incurred from HPC compute resource usage.
- Workstation Cost: Total cost incurred from workstation or node usage.
- Total Cost: Combined HPC and workstation cost for the project.
- Instance Type: The compute instance type (e.g., c6i.16xlarge) used for jobs.
- Total CPUs: Total number of CPU cores allocated across jobs.
- CPU Hours: Total compute hours consumed by allocated CPU cores.
- Total Nodes: Total number of nodes used across jobs.
- Node Hours: Aggregate time (in hours) for which nodes were in use.
- Job Count: Total number of jobs executed under the project.
- Avg CPU Cores: Average number of CPU cores used per job.
- Concurrent CPU Cores: Peak concurrent CPU cores utilized during job execution.
- Avg Job Duration: Average runtime duration of jobs (in hours).
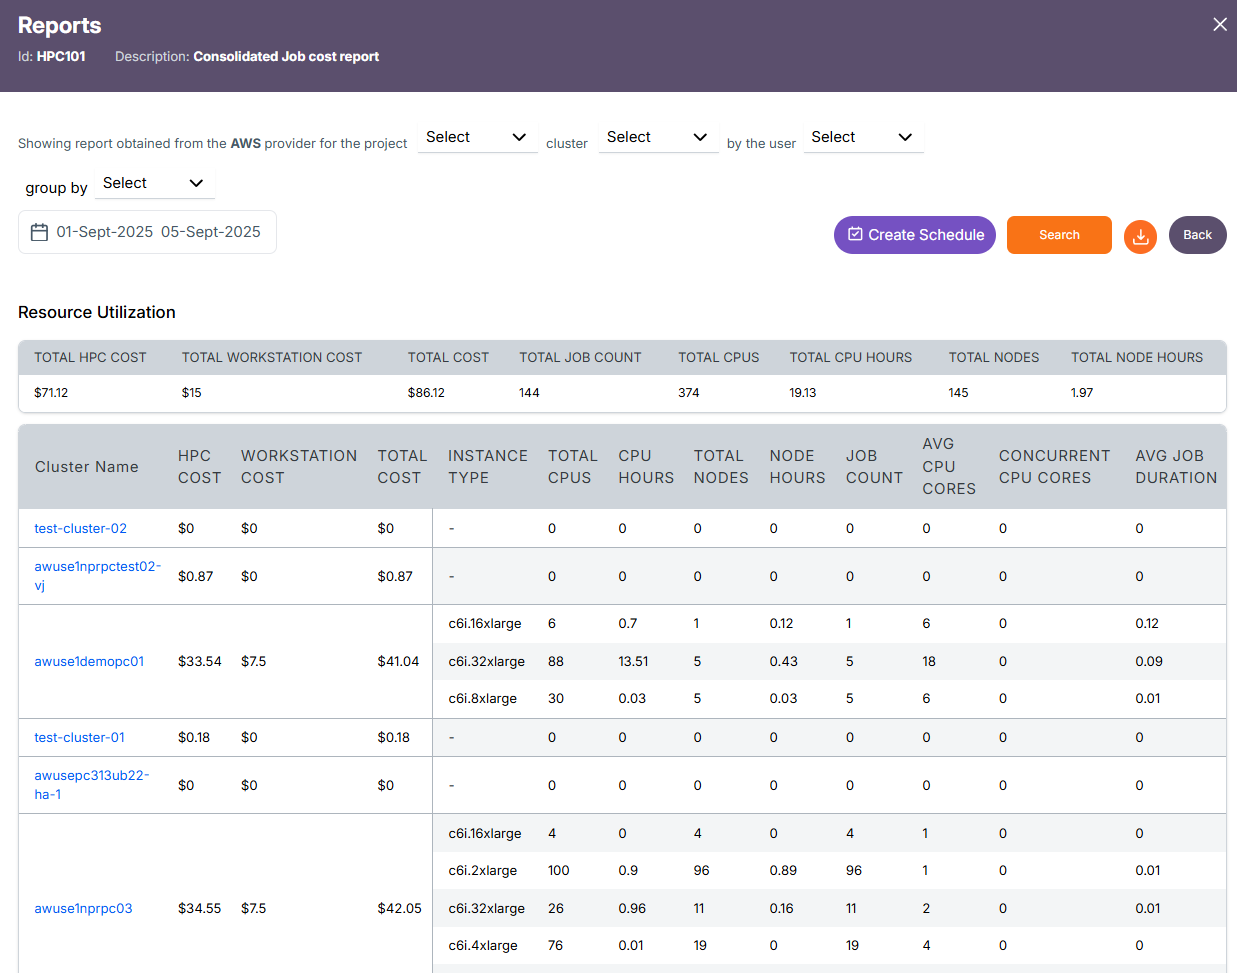
Cluster Level Report
Project(Eg.HPC) -> Cluster Details(respective cluster(s) for the selected project)
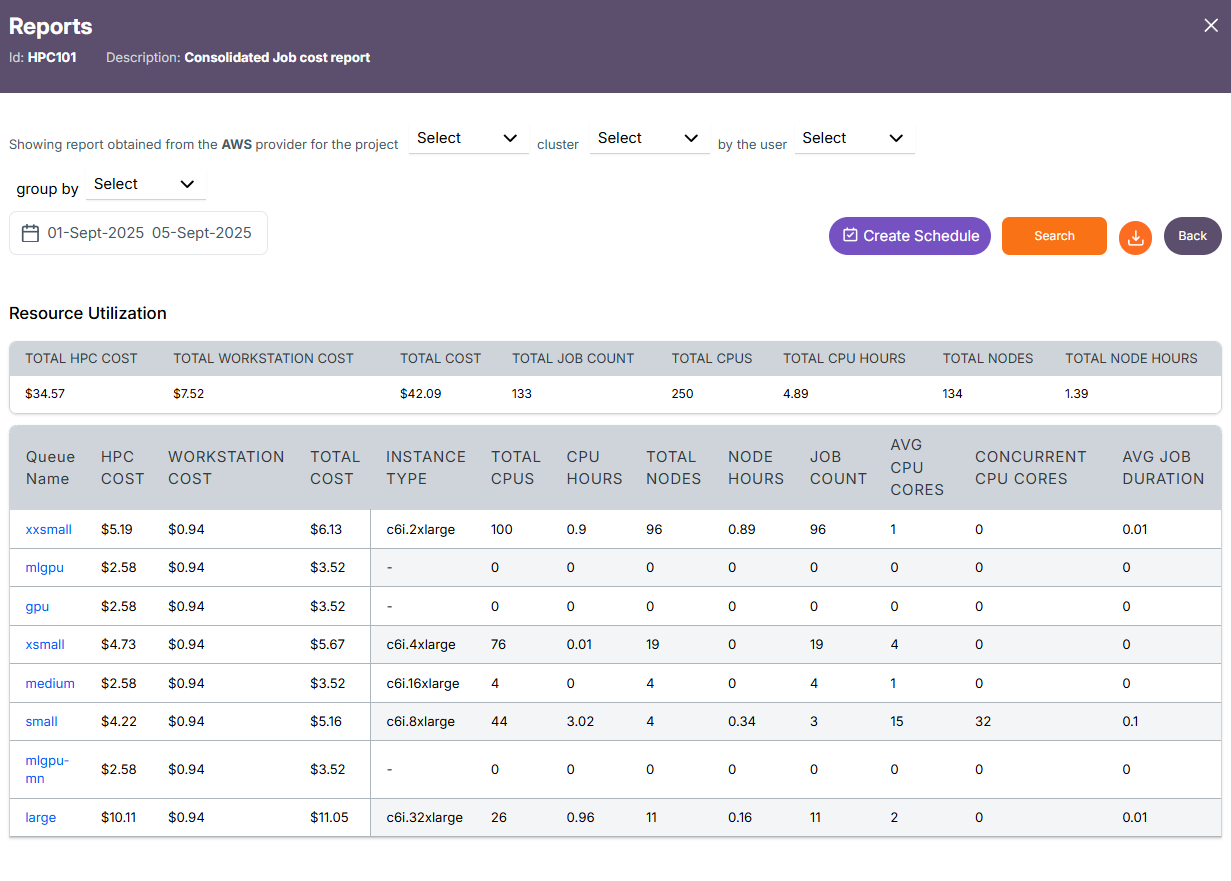
Queue Level Report
Cluster -> Queue Details(respective queue(s) for the selected cluster)
User Level Report
Queue -> User Details(respective user(s) for the selected queue)
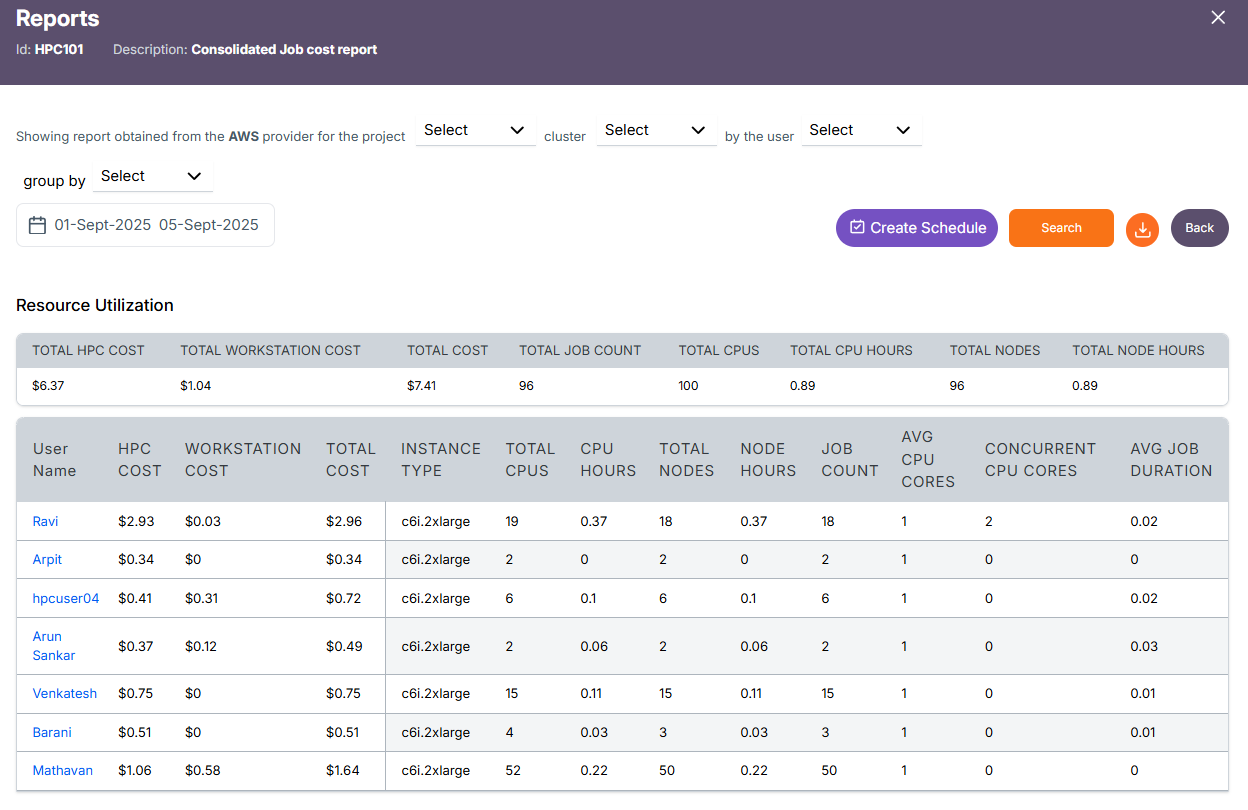
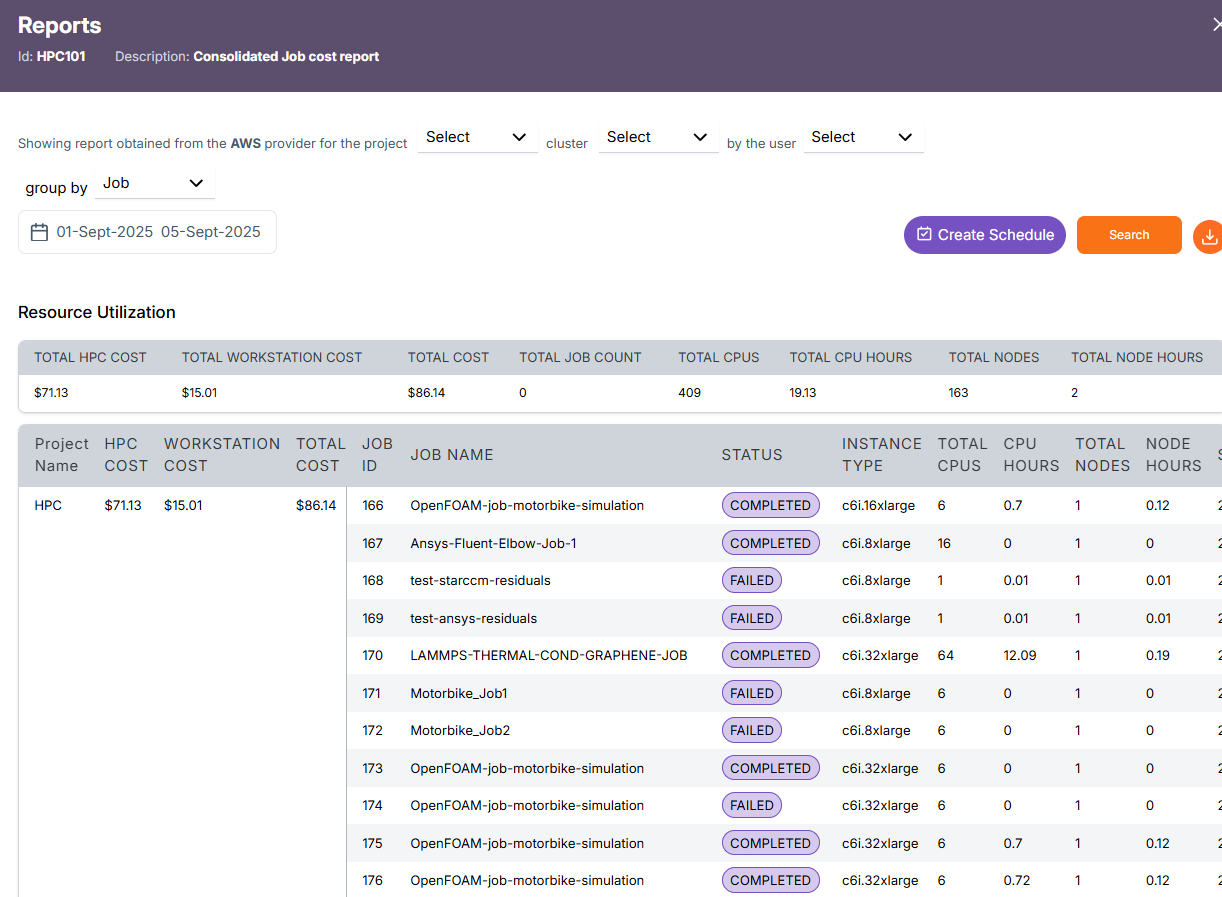
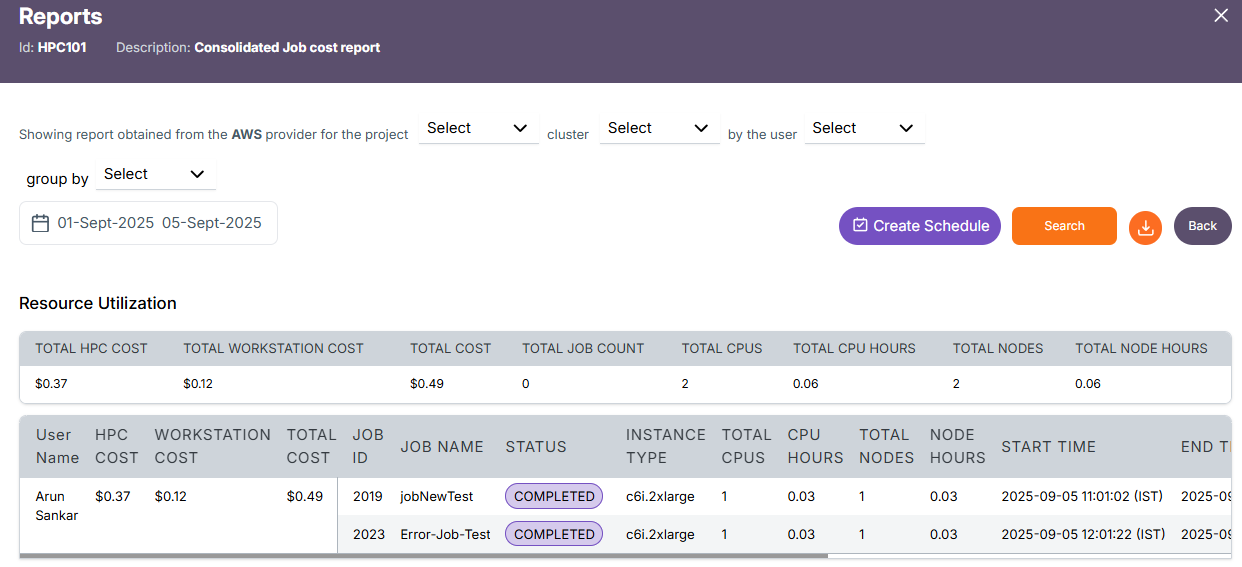
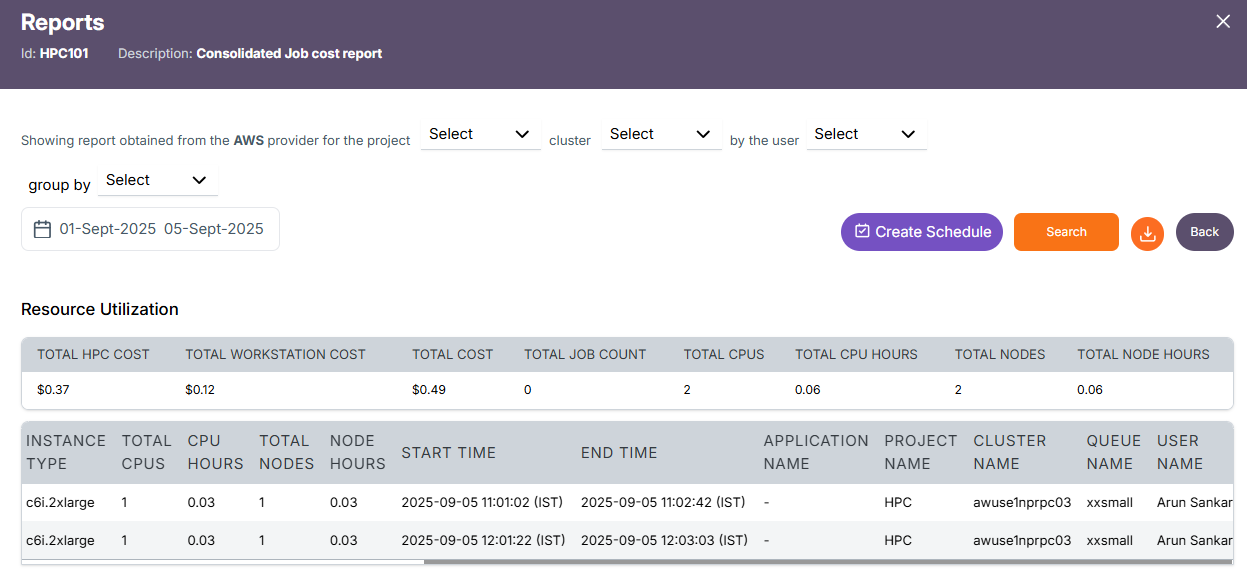
Job Level Report
User -> Job Details(respective Job(s) for the selected user)
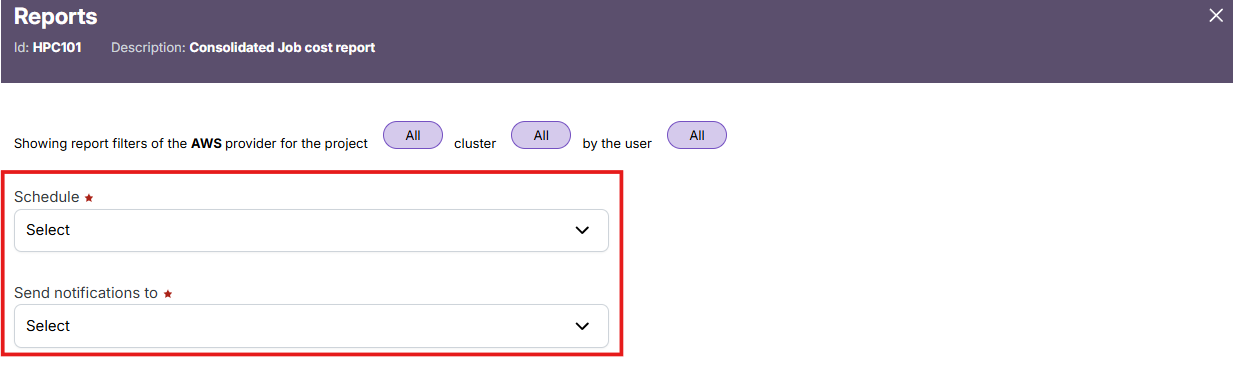
Schedule Creation
The Create Schedule feature allows you to automate report generation. Instead of manually selecting filters and running reports each time, you can schedule the report to run at regular intervals (e.g., daily, weekly) and have it emailed or stored for easy access.
-
Click on the Create Schedule button located near the top-right, beside the Search button.
-
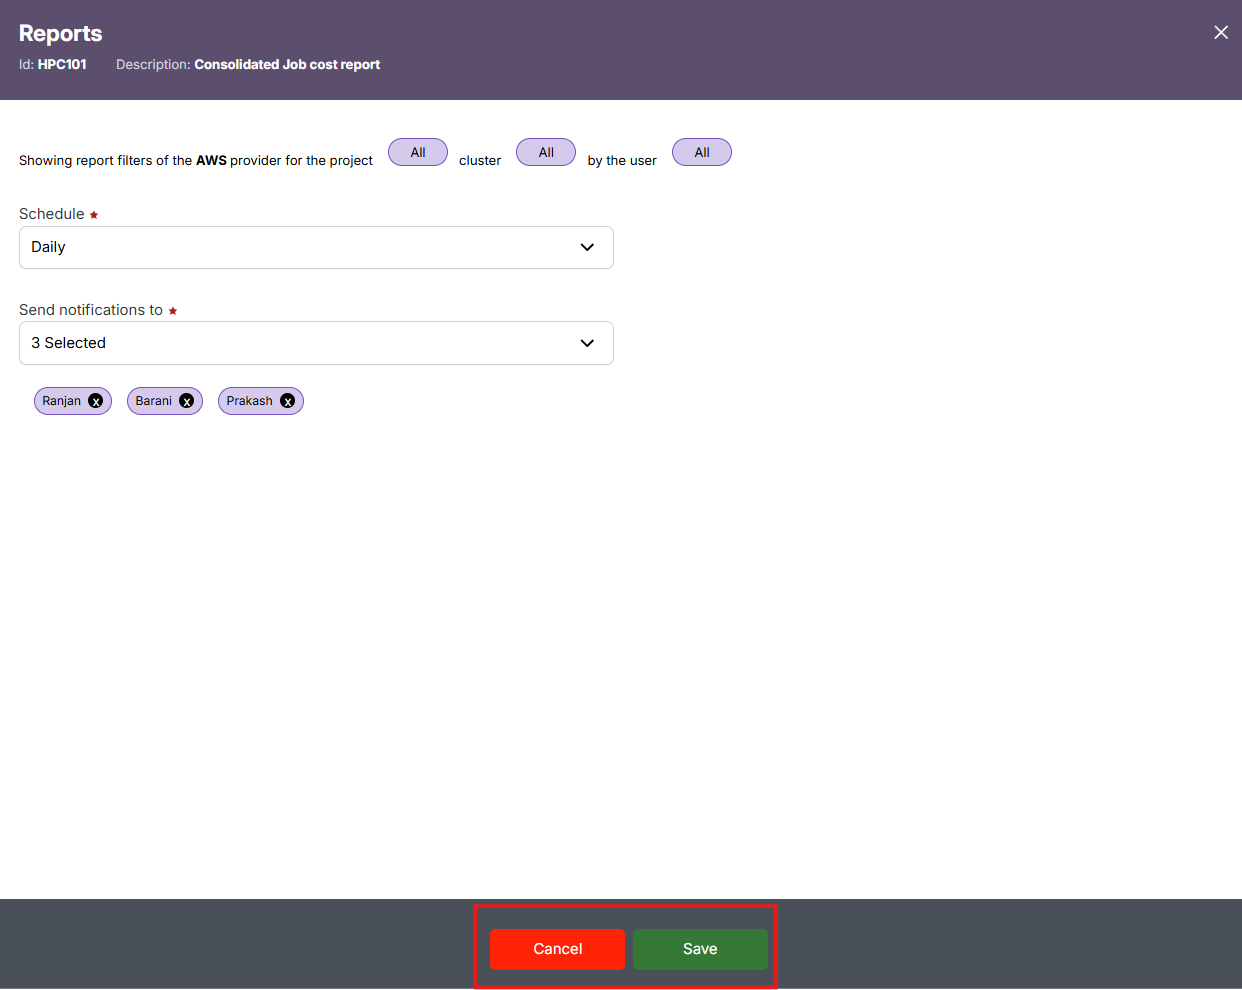
In the "Schedule" dropdown, select a schedule frequency (e.g., Daily, Weekly) and in the "Send notifications to" dropdown, choose the user(s) who should receive alerts when the report is generated.
-
Review the applied filters displayed at the top (like Provider, Project, Account, Region, Cluster, Queue, and User) – these will be locked to the schedule.
-
Click "Save" to finalize the schedule or "Cancel" to discard the setup.
-
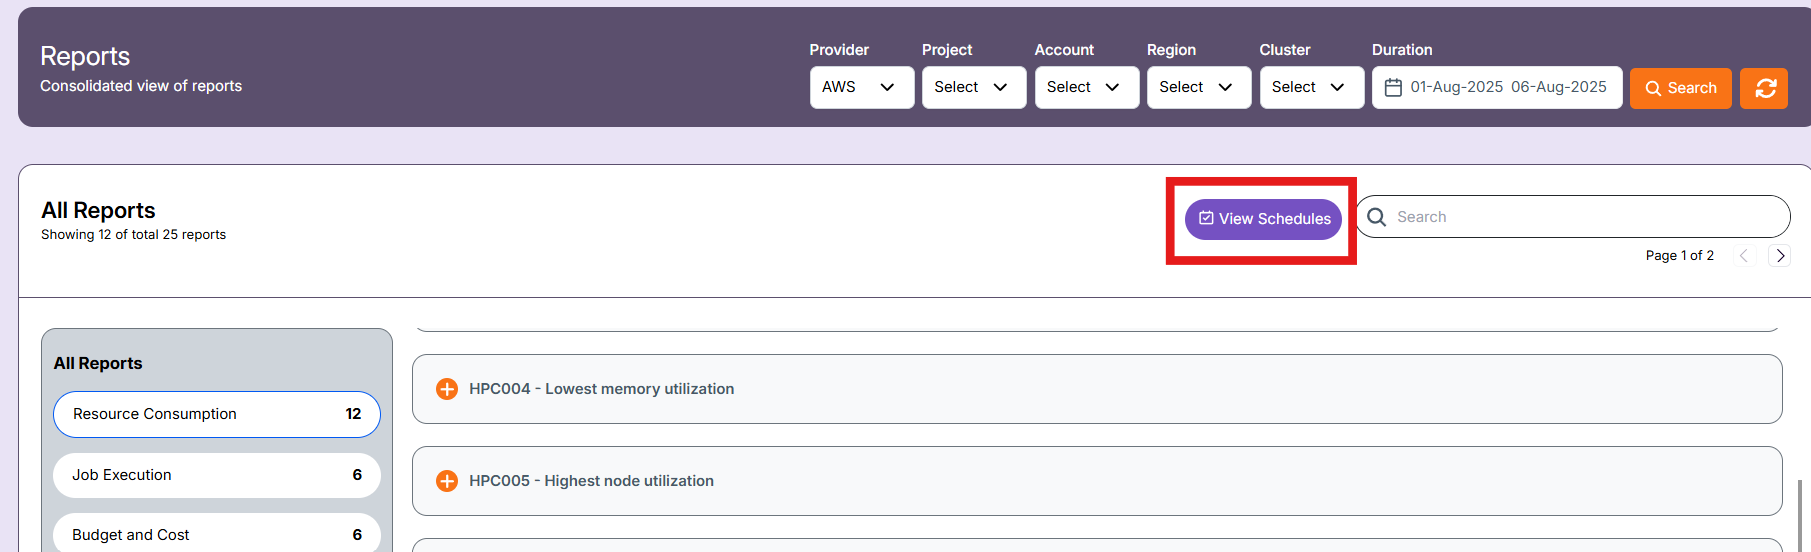
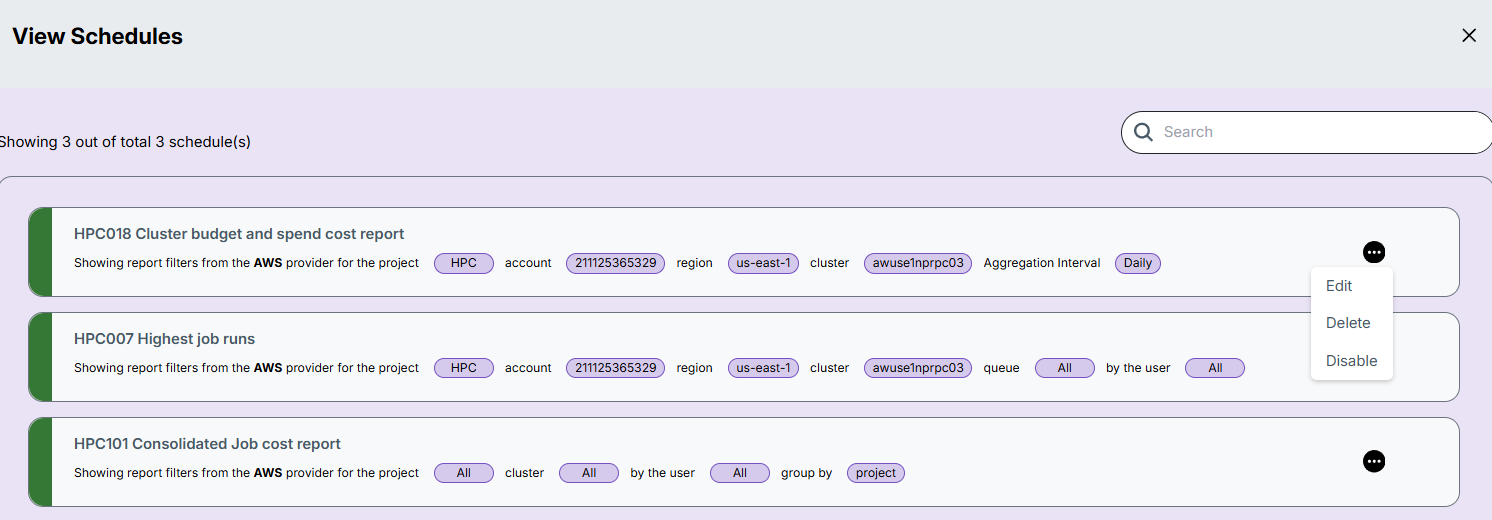
After saving the schedule, you can view them in the "view schedule" in landing page of report section.
-
There are three actions that can be performed on a schedule:
- Edit – Update schedule settings such as filters, time, or recipients.
- Delete – Remove the schedule permanently.
- Enable/Disable – Temporarily activate or deactivate the schedule without deleting it.
Export Report
The Download button at the top right corner allows you to export the report data in Excel format:
- Excel (.xlsx): Contains the tabular report data based on selected filters.
Export Format: Excel
Excel