Dashboard
Overview
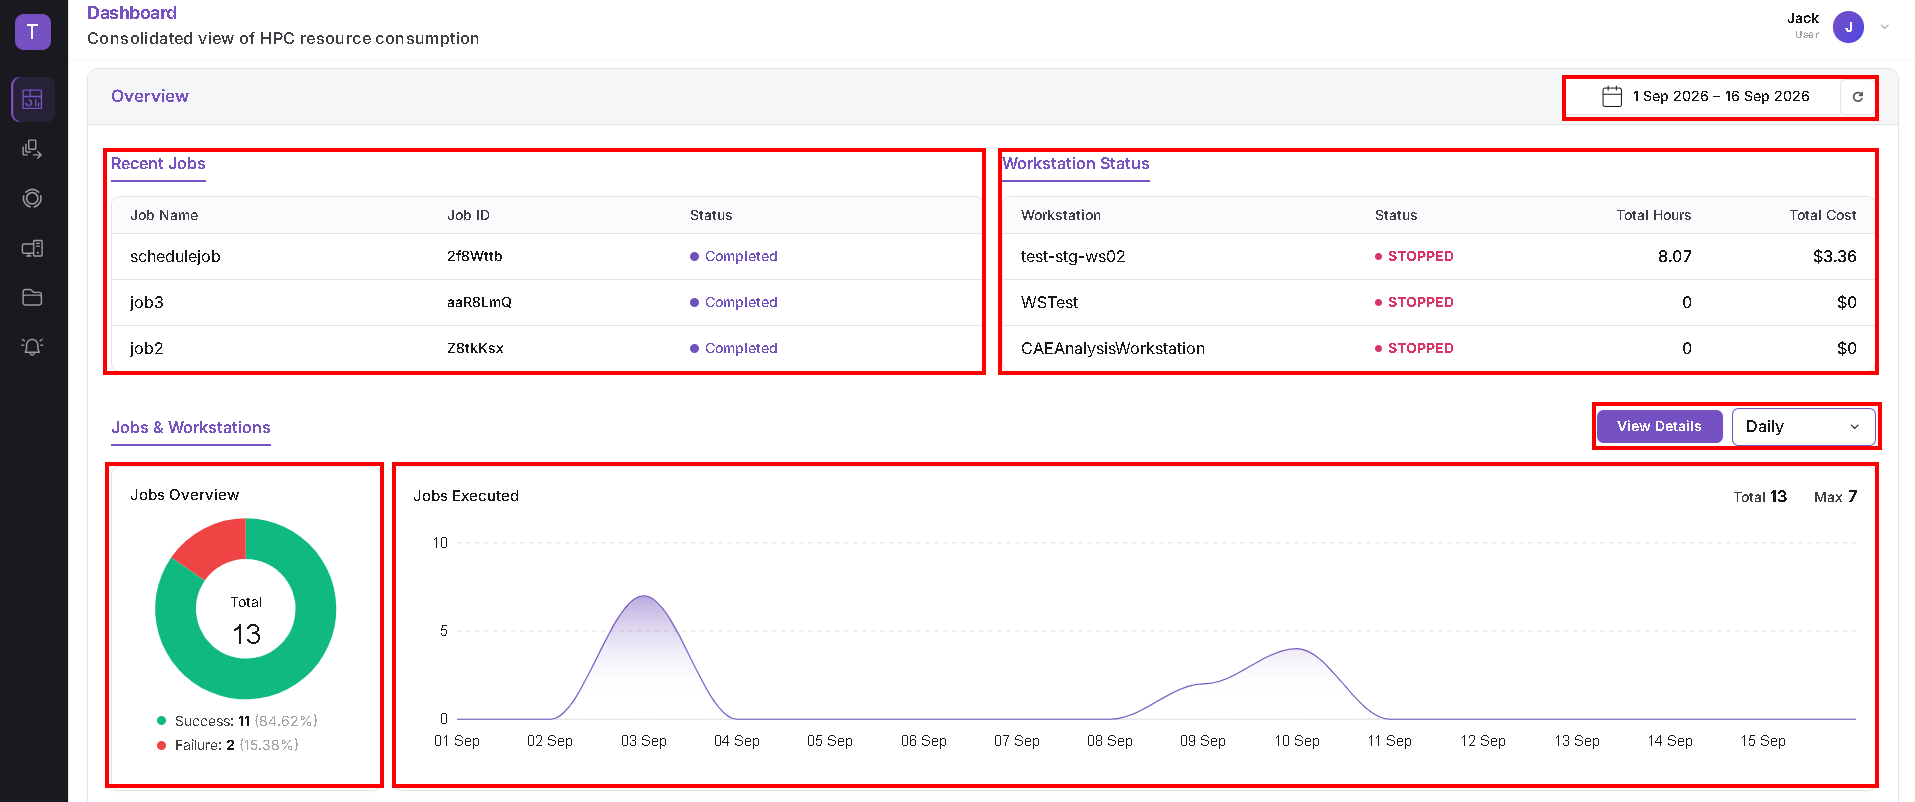
The Dashboard provides a consolidated view of your jobs, workstations, costs, and HPC resource consumption.
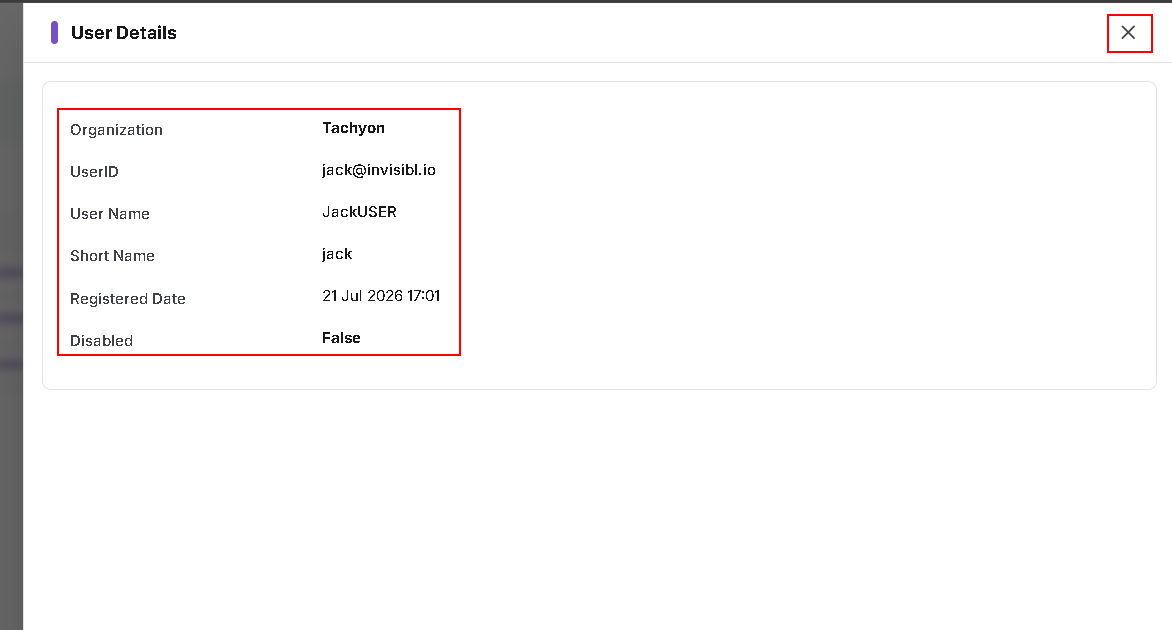
Open Dashboard from the navigation menu. Scroll down the page to review job activity, cost charts, resource metrics, and the resource report. The View Details button opens a separate User Details side panel.
Date Range and Refresh
At the top-right of the Overview section:
- Use the date-range selector to choose the period you want to review.
- Use the refresh icon beside it to refresh the dashboard data.
Recent Jobs and Workstation Status
The top of the dashboard contains two tables:
- Recent Jobs: Displays Job Name, Job ID, and Status.
- Workstation Status: Displays Workstation, Status, Total Hours, and Total Cost.
Jobs & Workstations
The Jobs & Workstations section displays:
- Jobs Overview: A summary of the total jobs and their success/failure breakdown.
- Jobs Executed: A chart showing job execution counts over time, with Total and Max values.
A time-grouping dropdown appears beside View Details. The screenshot below shows Daily selected.
Click View Details to open the User Details side panel, described later on this page.
Jobs by Status
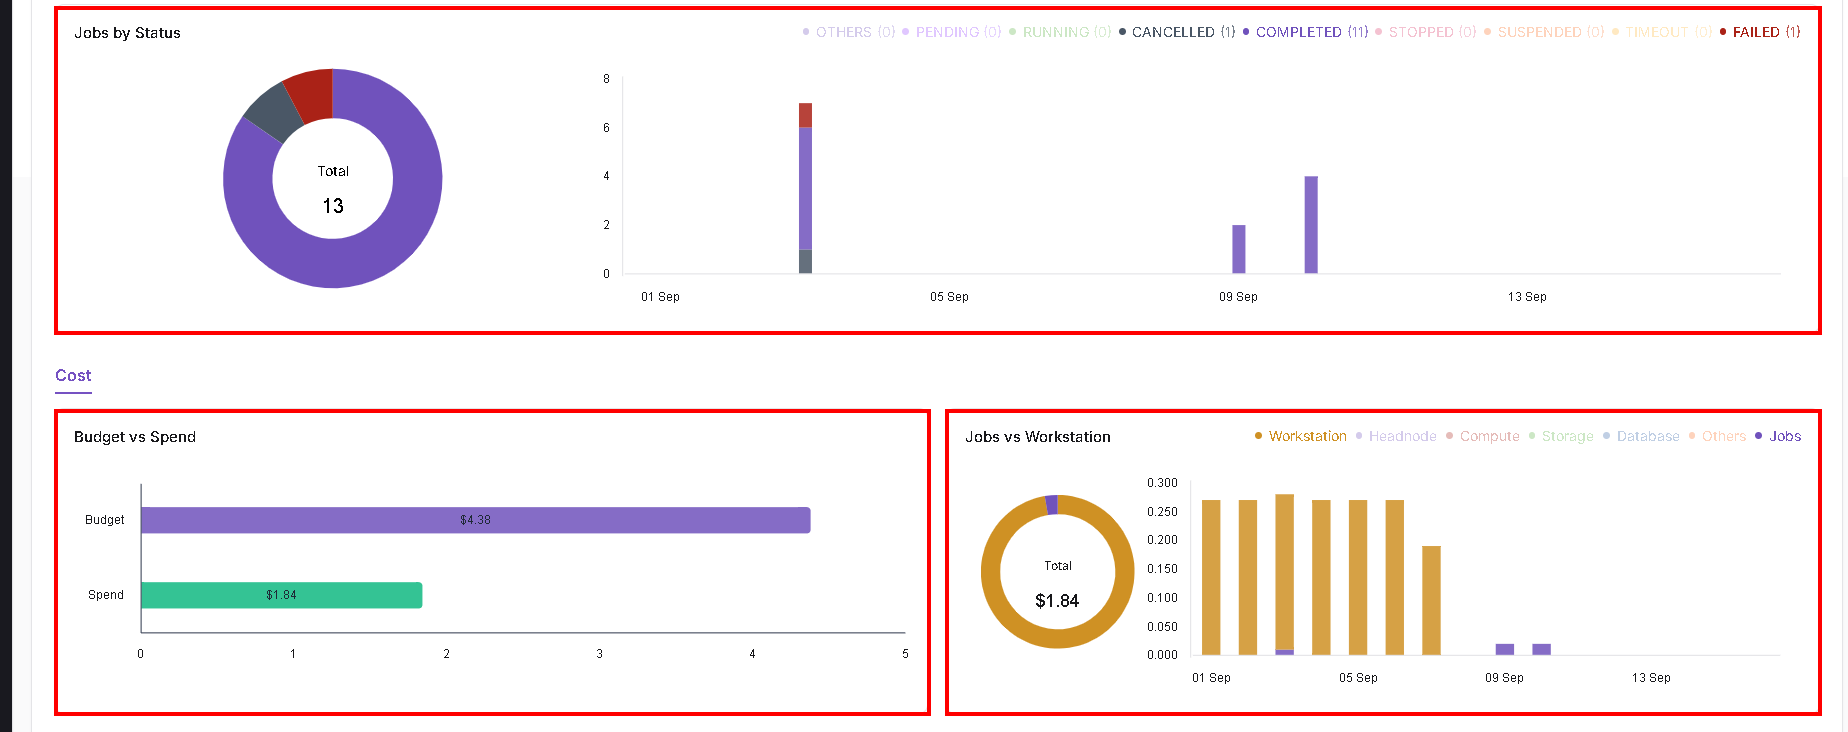
Scroll down to view Jobs by Status. This section includes a doughnut chart showing the status breakdown and a stacked bar chart showing statuses over time.
The legend includes Others, Pending, Running, Cancelled, Completed, Stopped, Suspended, Timeout, and Failed.
Cost
The Cost section appears below Jobs by Status and contains:
- Budget vs Spend: Compares the displayed budget and spend.
- Jobs vs Workstation: Shows the cost breakdown and its distribution over time. The legend includes Workstation, Headnode, Compute, Storage, Database, Others, and Jobs.
Resources
Continue scrolling to the Resources section.
CPU Metrics
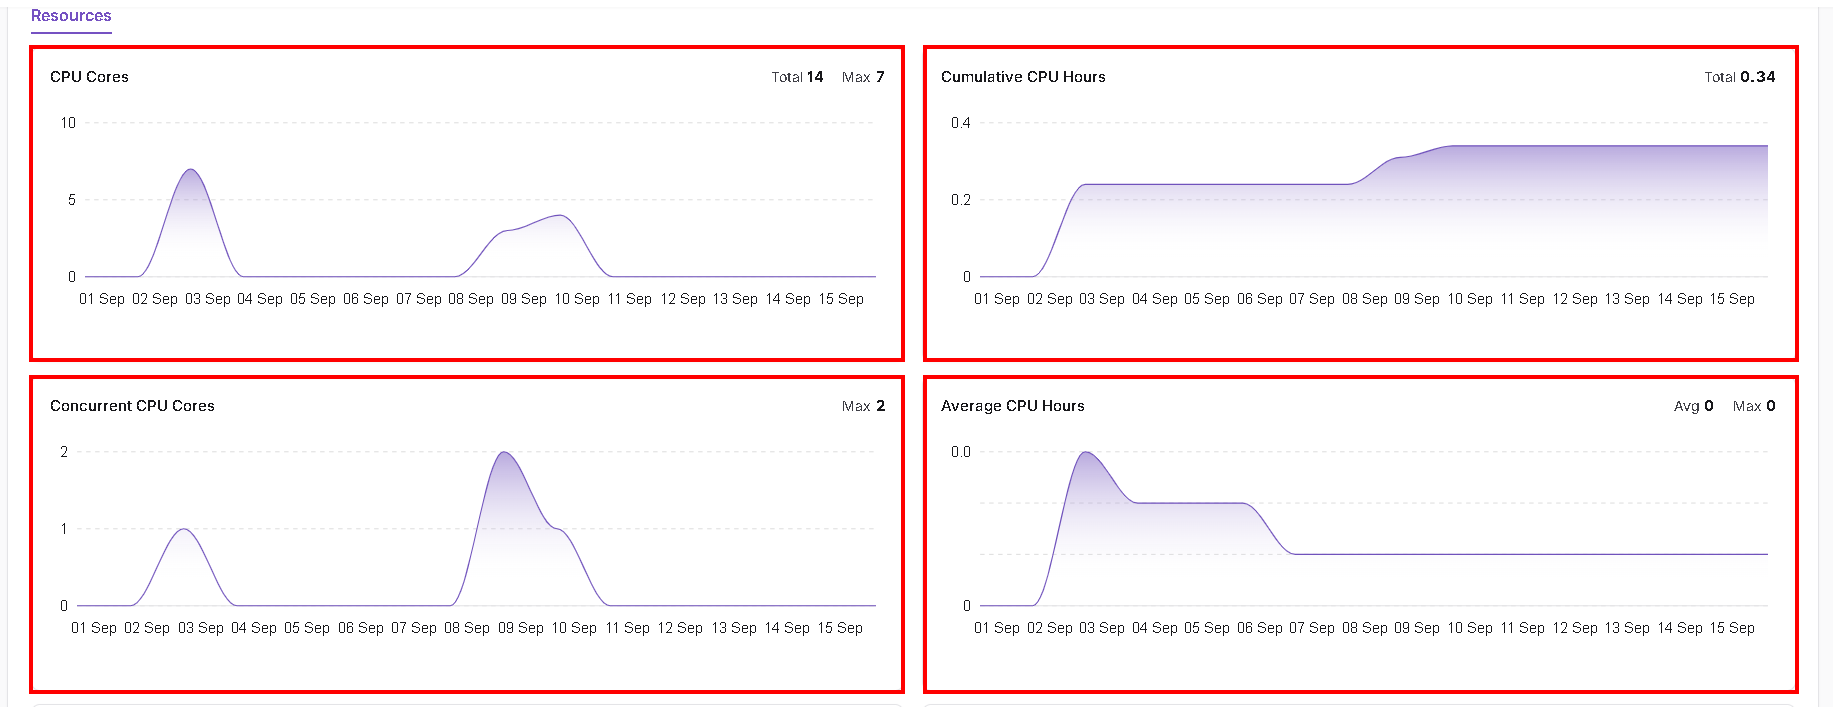
The CPU charts display:
- CPU Cores: CPU core counts over time, with Total and Max values.
- Cumulative CPU Hours: Accumulated CPU hours over the displayed period.
- Concurrent CPU Cores: Concurrent core usage over time, with a Max value.
- Average CPU Hours: Average CPU hours over time, with Avg and Max values.
Node Metrics
Below the CPU charts, the dashboard displays:
- Total Nodes: Node counts over time, with Total and Max values.
- Node Hours: Node-hour usage over time, with Total and Max values.

Computational Resource Report
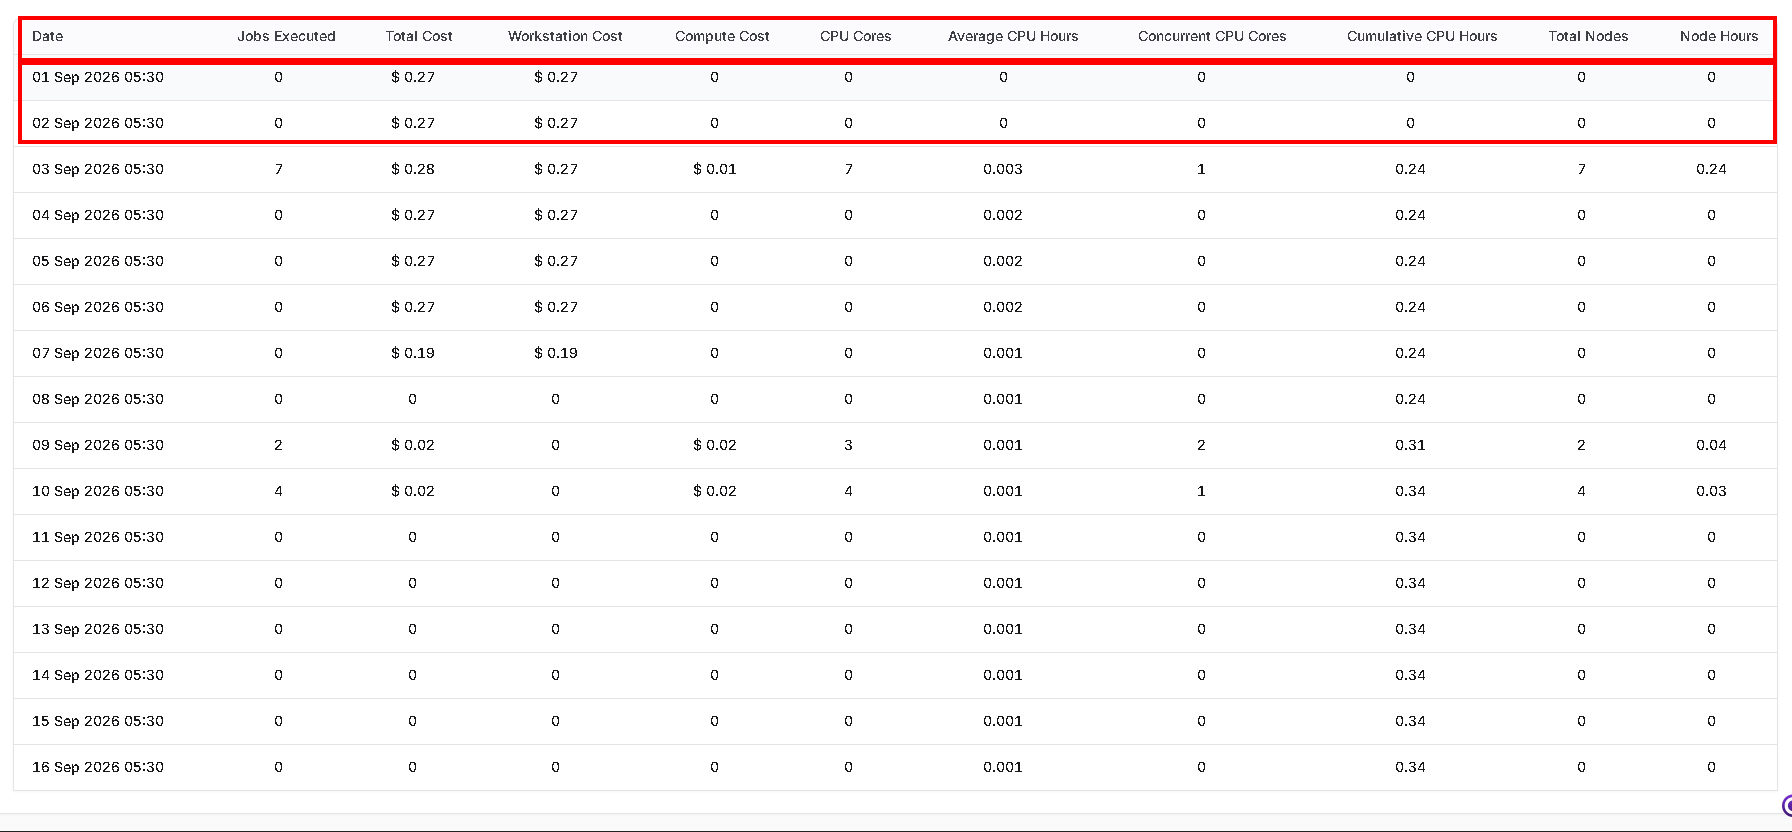
The table below the resource charts provides a detailed breakdown of job activity, costs, and resource metrics by date.
It contains the following columns:
- Date
- Jobs Executed
- Total Cost
- Workstation Cost
- Compute Cost
- CPU Cores
- Average CPU Hours
- Concurrent CPU Cores
- Cumulative CPU Hours
- Total Nodes
- Node Hours
The screenshot below shows daily entries.
View User Details
To view your user information:
- Return to the Jobs & Workstations section.
- Click View Details, beside the time-grouping dropdown.
- Review the User Details side panel.
The panel displays:
- Organization
- UserID
- User Name
- Short Name
- Registered Date
- Disabled
Click the X at the top-right of the panel to close it and return to the dashboard.
General Notes
- Check the selected date range when reviewing dashboard values.
- The dates, counts, and costs in these screenshots are example values and will vary with your account activity.
- Contact your administrator if you encounter dashboard issues or need help understanding the displayed information.