Licenses Dashboard
The Licenses Dashboard provides a consolidated view of license usage. Administrators can review usage by job, solver, and user, examine usage over time, and view license records for a selected environment and reporting period.
Open the Licenses Dashboard
- Sign in with your administrator account.
- Expand HPC in the left navigation menu.
- Select Licenses Dashboard. The page heading is Licenses.
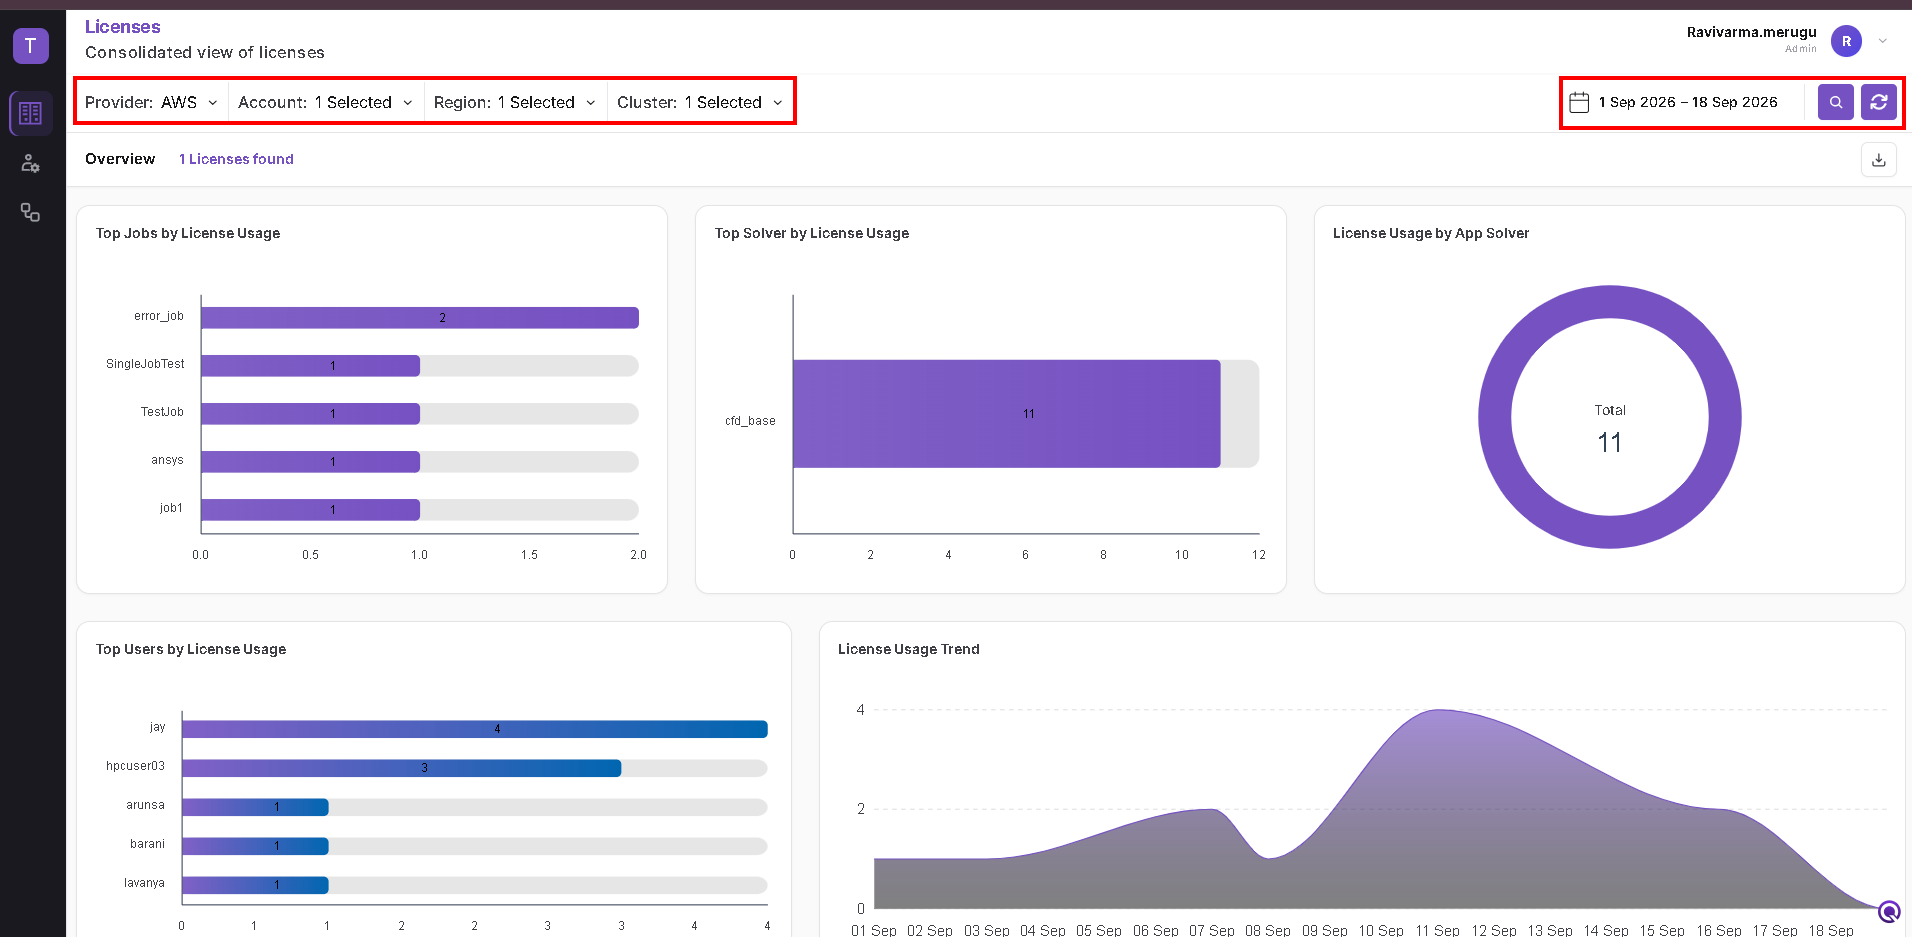
The Overview row displays the number of licenses found for the selected filters. Names, dates, and values in the screenshots are examples from the selected environment.
Select the Environment
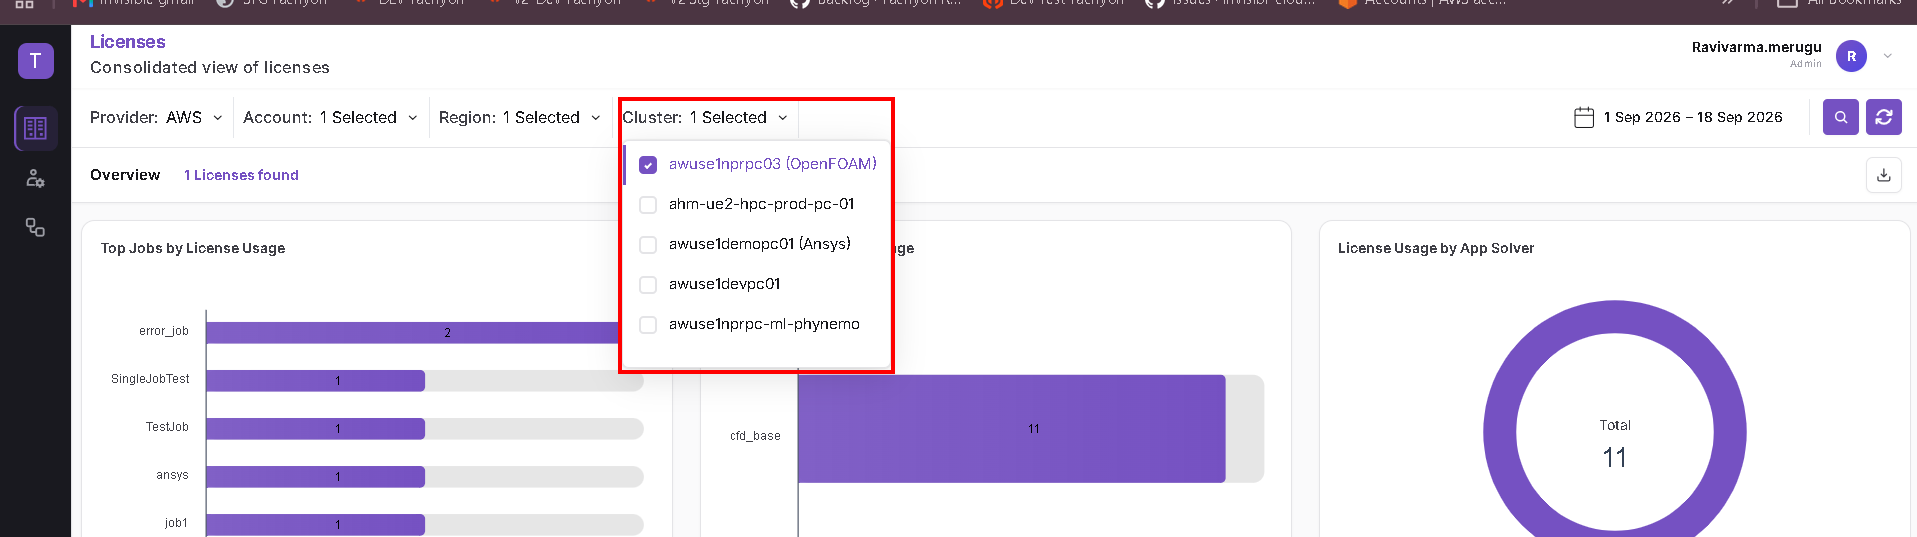
Use the filters at the top of the page to choose the environment to review.
| Filter | Selection |
|---|---|
| Provider | Cloud provider; the example uses AWS. |
| Account | Cloud account to include. |
| Region | Region to include. |
| Cluster | Cluster or clusters to include, selected using the dropdown checkboxes. |
The dropdowns display selection counts, such as 1 Selected. The example cluster is awuse1nprpc03 (OpenFOAM); choose the cluster relevant to your work.
Choose the Reporting Period and Search
- Click the calendar/date-range control at the upper right.
- Choose the start and end dates, or select a preset under Quick Select.
- Click Apply in the calendar.
- Click the purple Search button with the magnifying-glass icon beside the date range to retrieve results for your selection.
The available presets shown are Today, Yesterday, Last 7 Days, Last 30 Days, Month to Date, Last Month, and Year to Date. The calendar also includes Close and Clear controls.
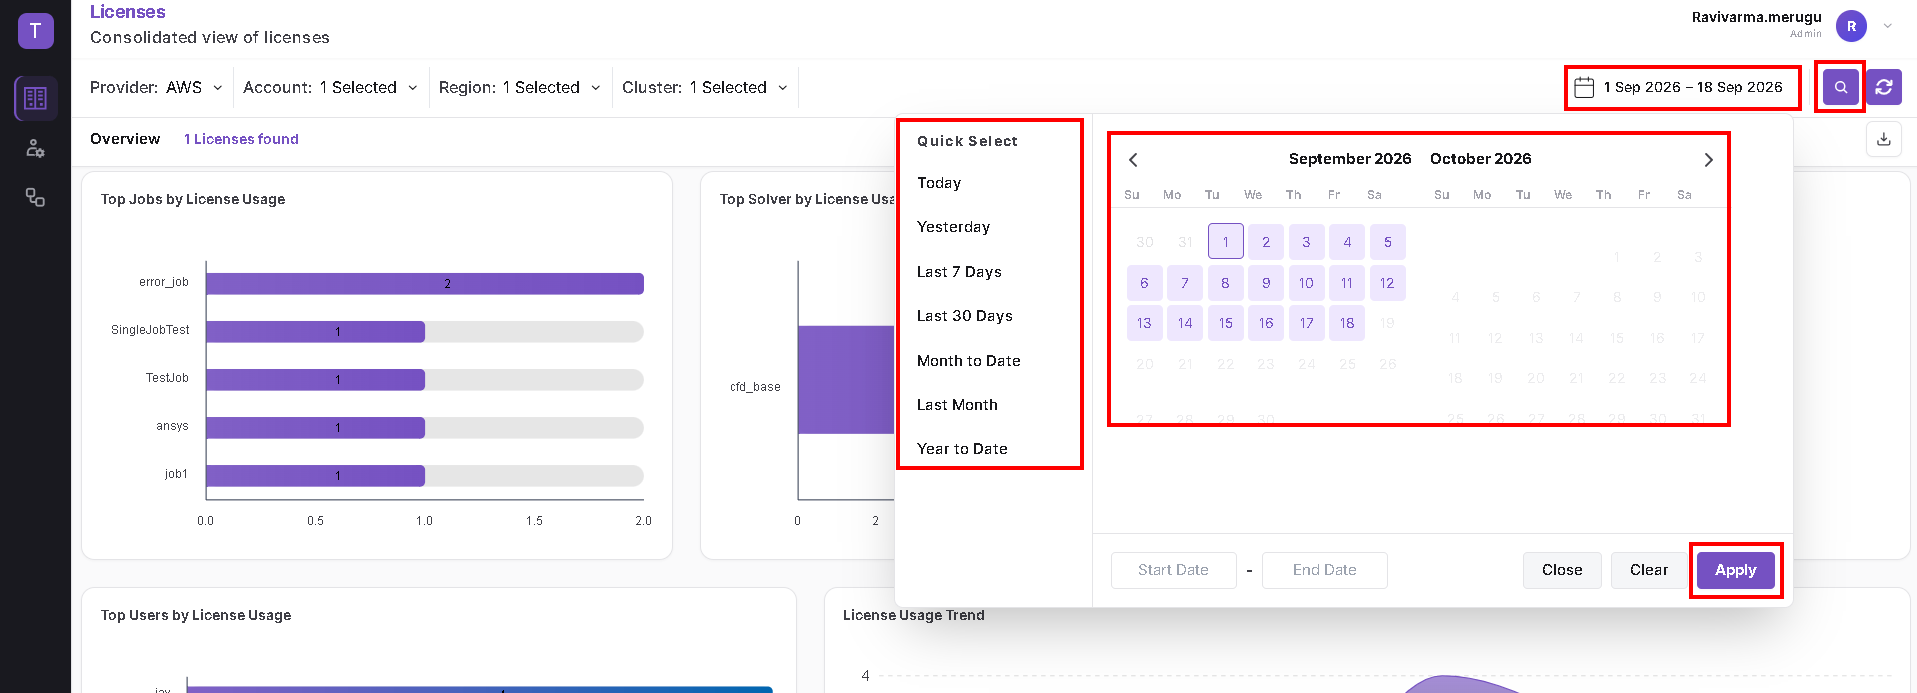
After changing filters or reporting dates, click Search again. Use the adjacent circular-arrow Refresh button to reload the view.
Review License Usage
The Dashboard contains five charts:
| Chart | What it shows |
|---|---|
| Top Jobs by License Usage | Jobs ranked by the license usage values shown on their bars. |
| Top Solver by License Usage | License usage grouped by solver, such as cfd_base in the example. |
| License Usage by App Solver | A donut chart showing usage by app solver and a total in the center. |
| Top Users by License Usage | Users ranked by the license usage values shown on their bars. |
| License Usage Trend | License usage over the dates in the selected reporting period. |
Review the job and solver charts at the top, then scroll down to compare user usage and the trend over time.
The licenses found count and chart usage totals are separate values. For example, the screenshots show 1 Licenses found, while the app-solver chart displays Total 11. Read each value together with its label.
Review the License List
Scroll below the charts to reach License List. The Period displayed above the table identifies the reporting interval associated with the list.
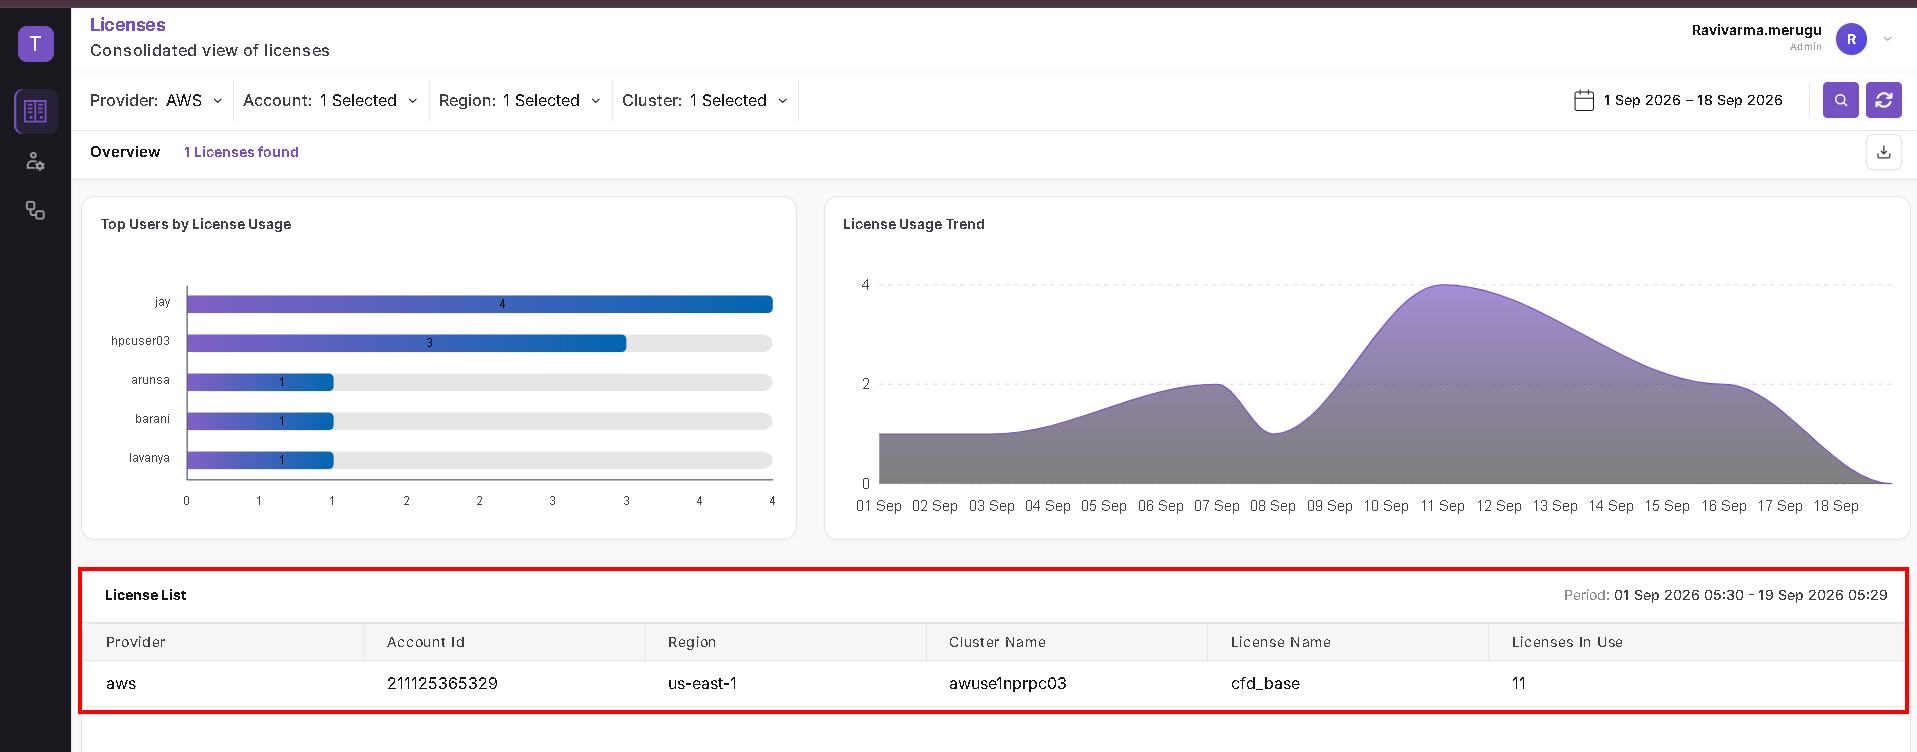
| Column | Information shown |
|---|---|
| Provider | Cloud provider associated with the record. |
| Account Id | Cloud account identifier. |
| Region | Cloud region. |
| Cluster Name | Cluster associated with the license record. |
| License Name | License identifier, such as cfd_base. |
| Licenses In Use | Reported usage value for the record. |
Use the list to connect the displayed usage to its provider, account, region, cluster, and license name. The example lists cfd_base with Licenses In Use: 11; this is a sample value for the displayed period.
Download Control
The down-arrow Download button is at the far right of the Overview row, below the Search and Refresh controls. Select the required filters and reporting period, retrieve the results with Search, then use this button to request a download.