Spendboard
The Spendboard provides budget-versus-spend analysis for the selected infrastructure or ownership dimension.
Navigation
Navigate to:
Billing → Spendboard
Filter Spendboard Data
The filter bar contains:
- Provider
- Account
- Region
- Type
- A selection control corresponding to the selected Type
- Cluster
- Date
- Search
- Refresh
The Type menu currently displays:
- Cluster
- Queue
- User
- Project
- Application
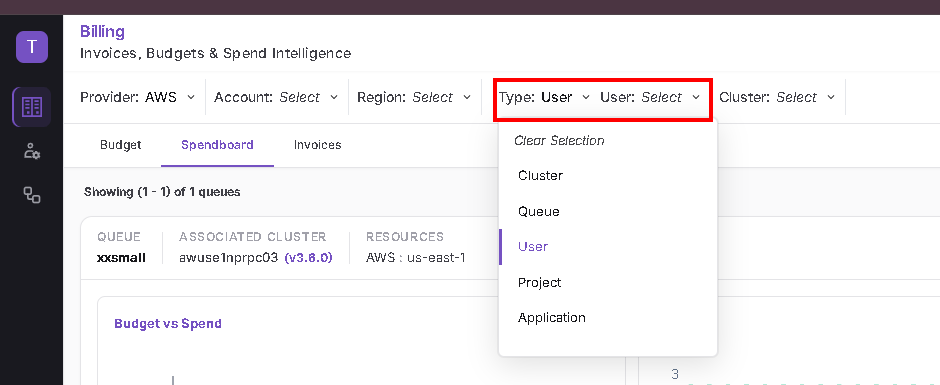
Apply a Filter
- Select the required Provider, Account, and Region.
- Select the required Type.
- Select the corresponding cluster, queue, user, project, or application value.
- Select a Cluster when the selected type requires it.
- Select the required date/date range.
- Click Search.
- Use Refresh to reload the result.
Validated Spendboard views include Cluster, Queue, User, Project, and Application.
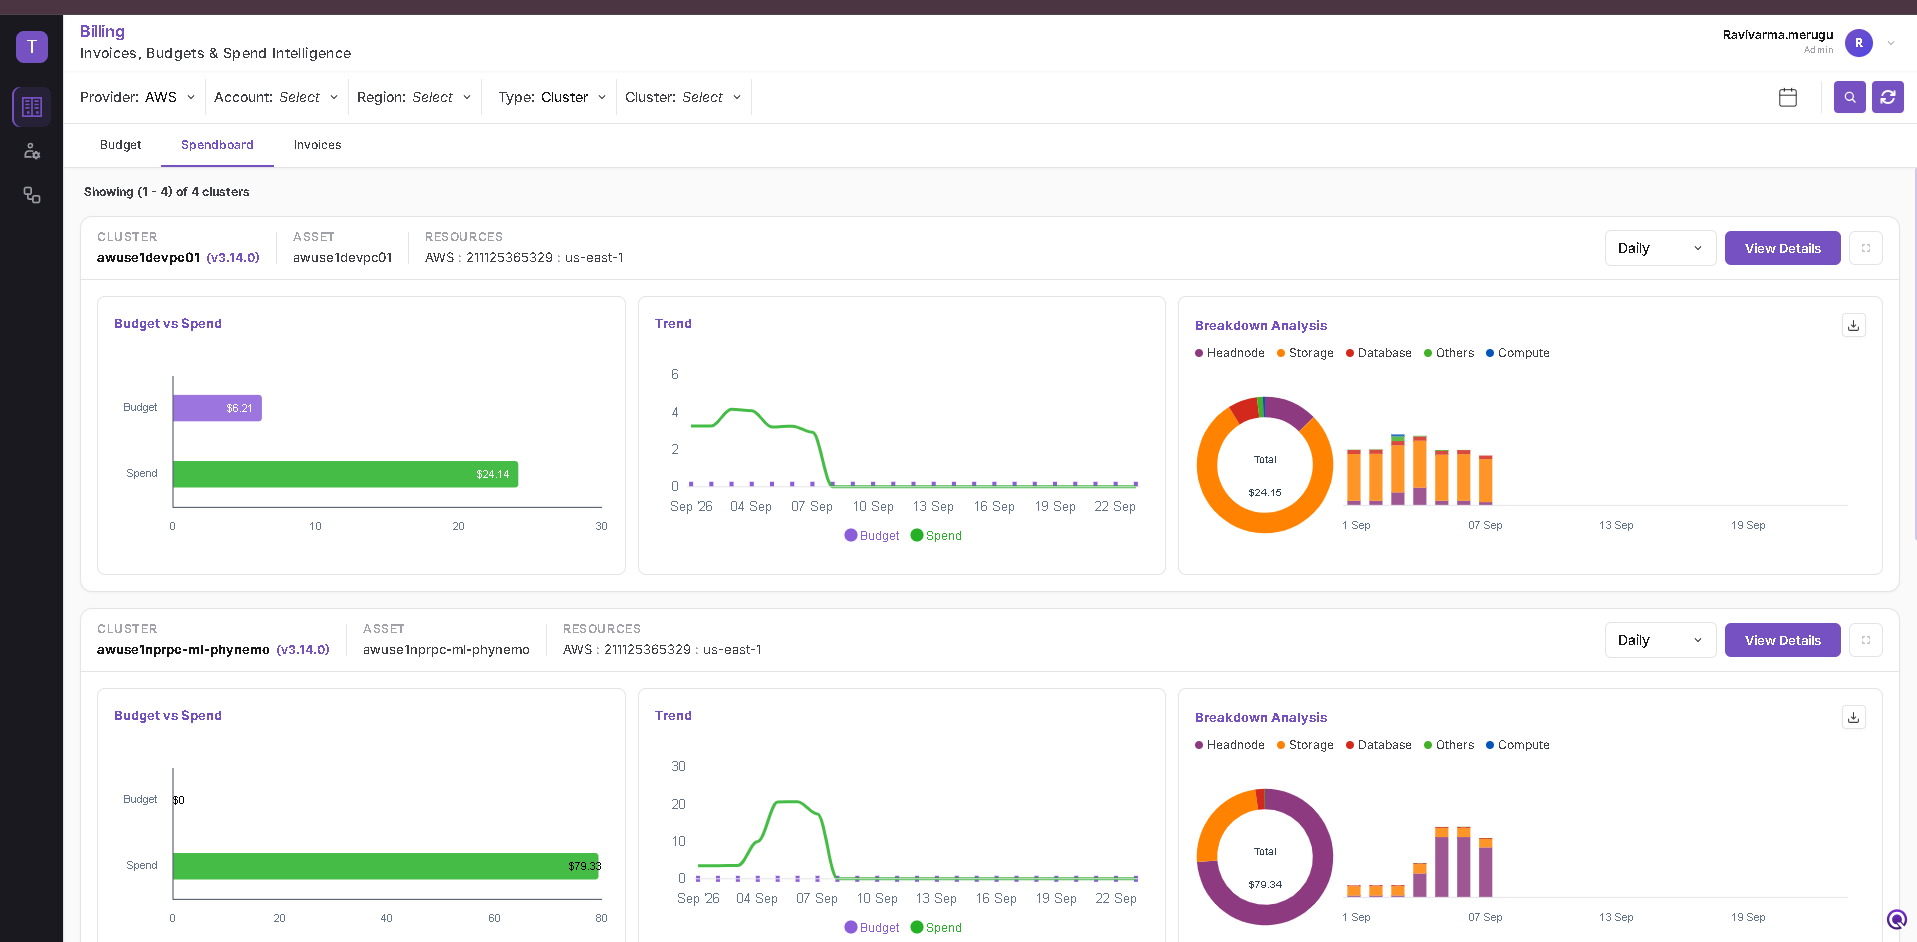
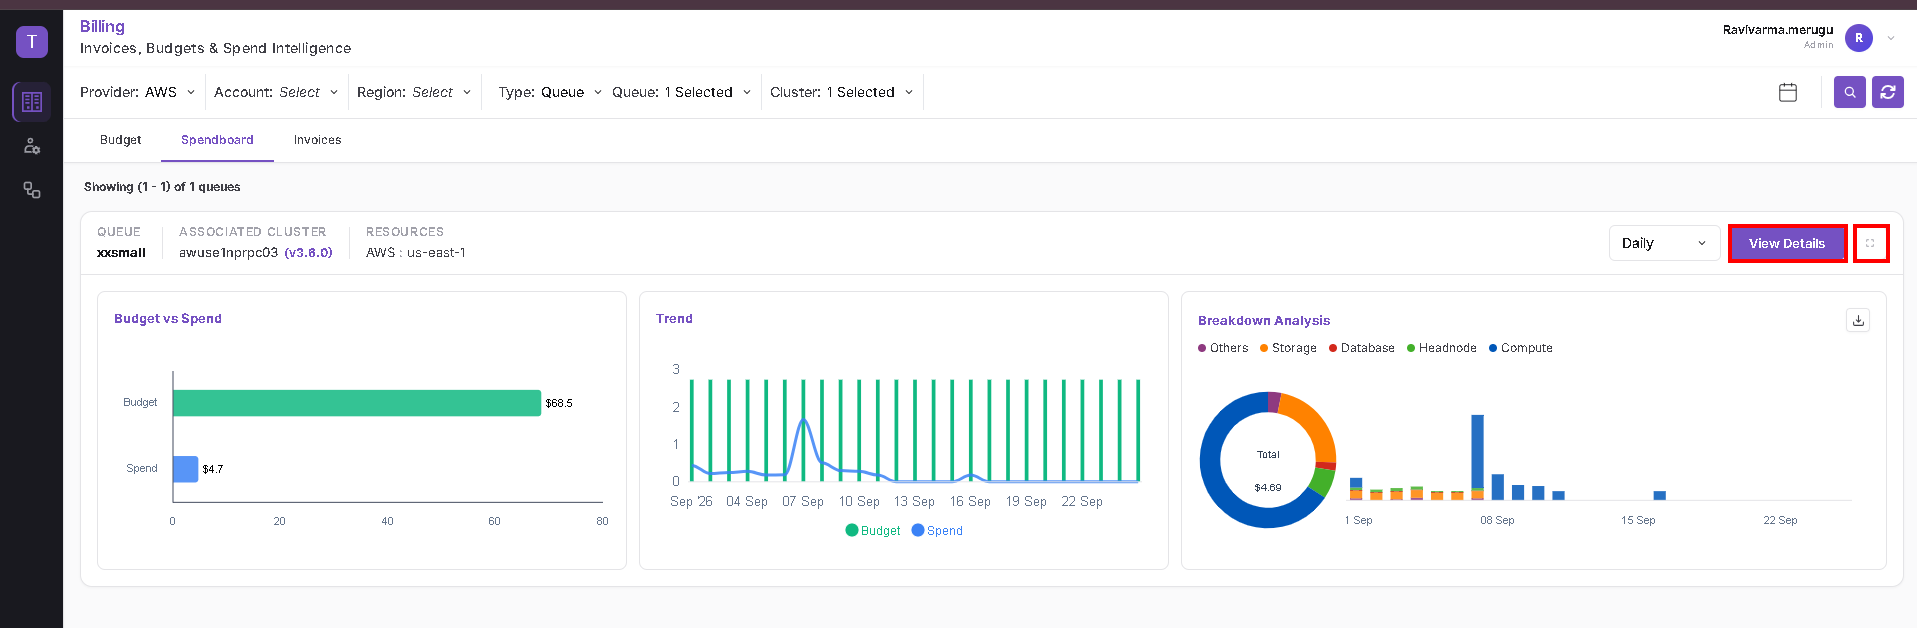
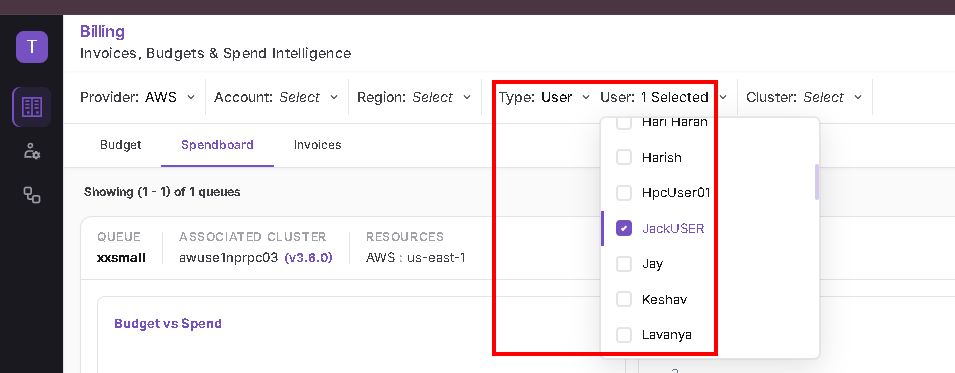
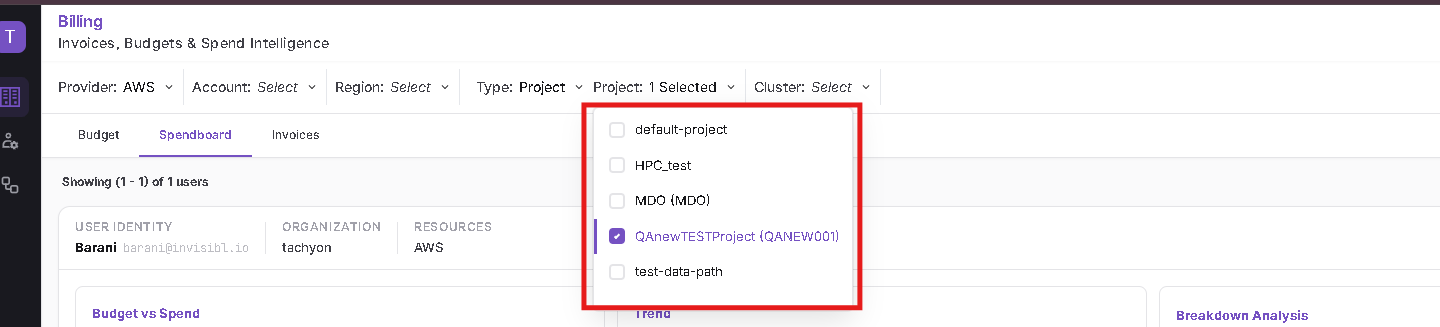
Spendboard Result
Each returned result displays information relevant to the selected Type and can include:
- Selected entity information and associated cluster/resources.
- Budget vs Spend
- Trend
- Breakdown Analysis
- Time aggregation such as Daily
- View Details
- Expand/full-screen analysis
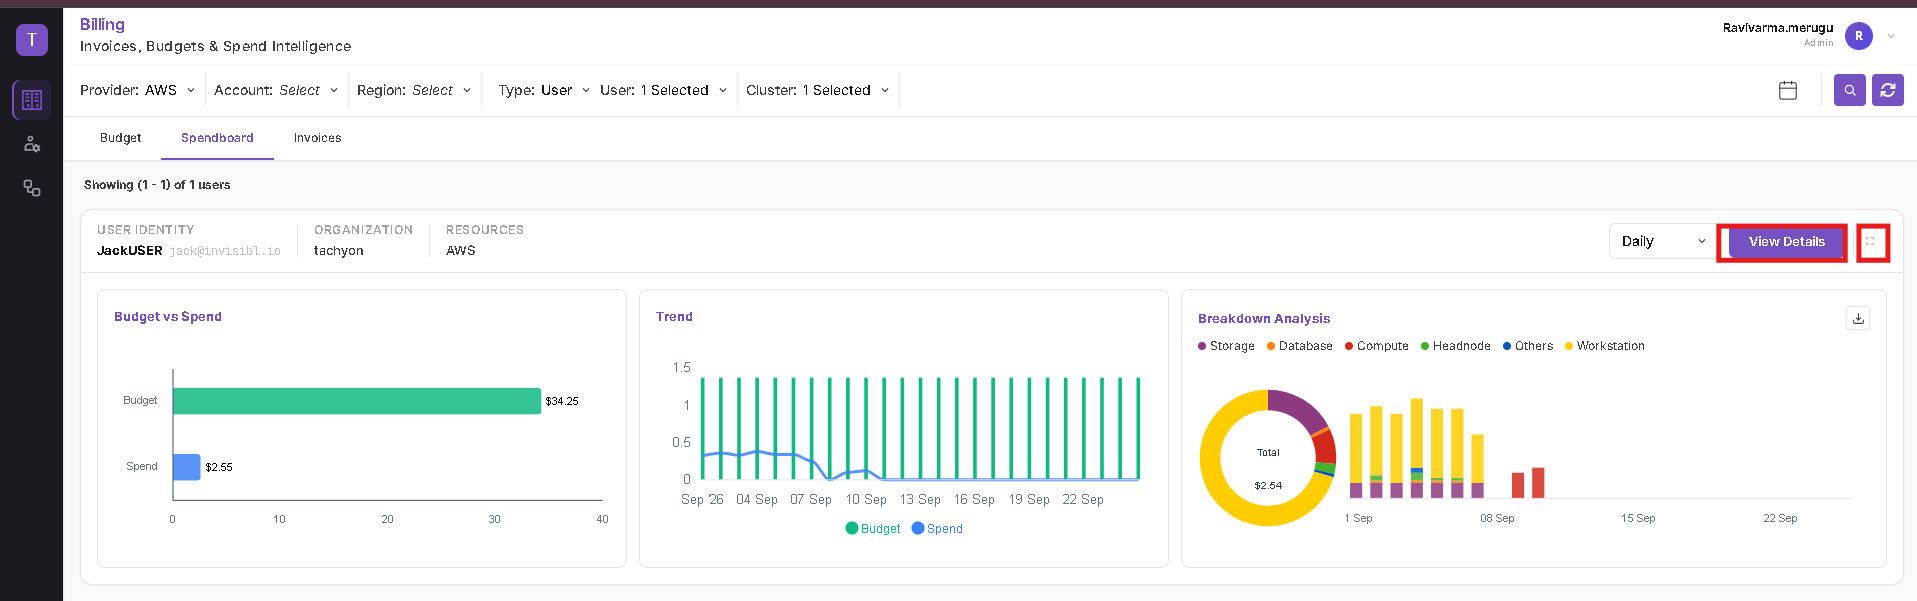
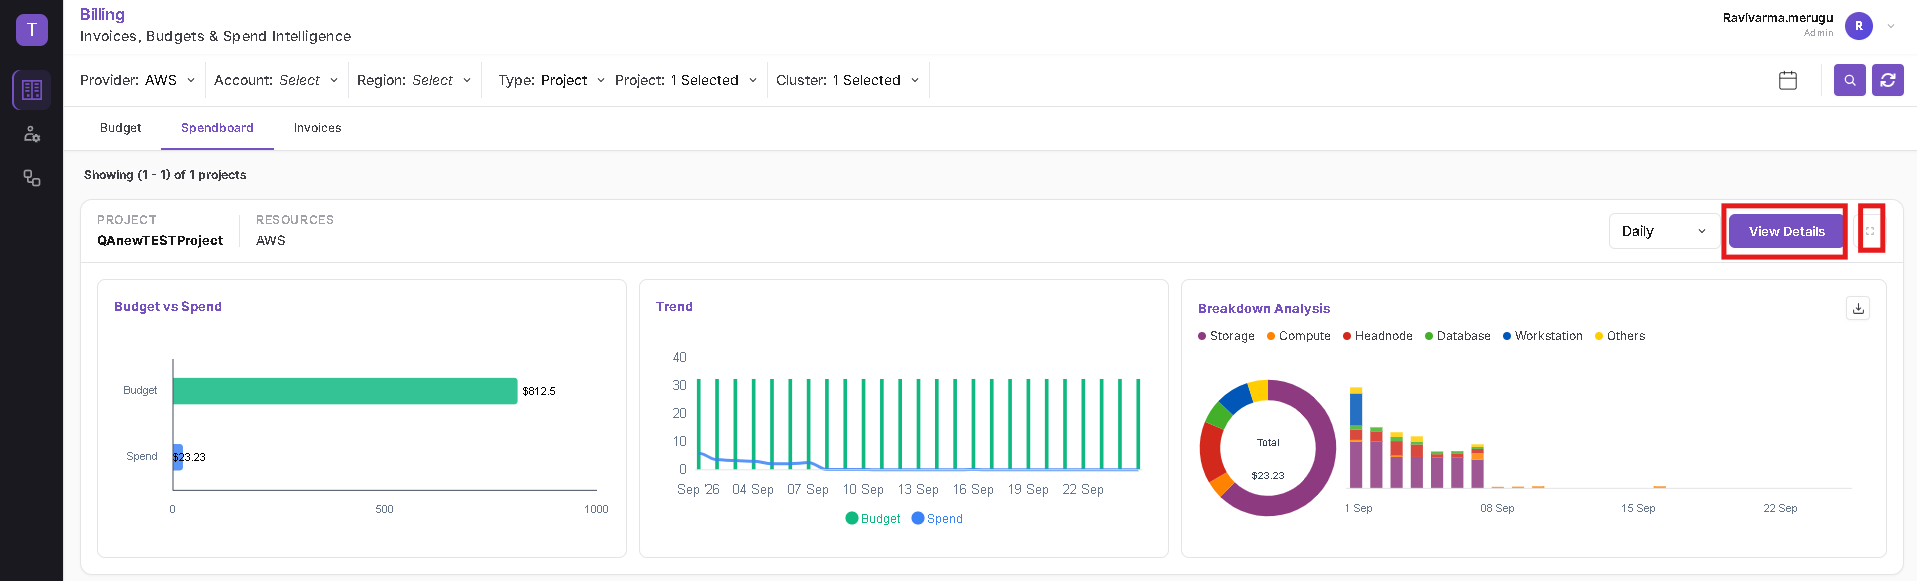
View Details
Click View Details on a result to open the detail panel.
The panel provides Details and Jobs tabs. The information displayed depends on the selected Spendboard Type.
Examples include:
- Queue – Queue details, capacity details, queue configuration, compute resources, and additional information.
- User – User information and the associated cluster details.
- Project – Project details and workload/job spending information.
- Cluster – Cluster configuration and related resource details.
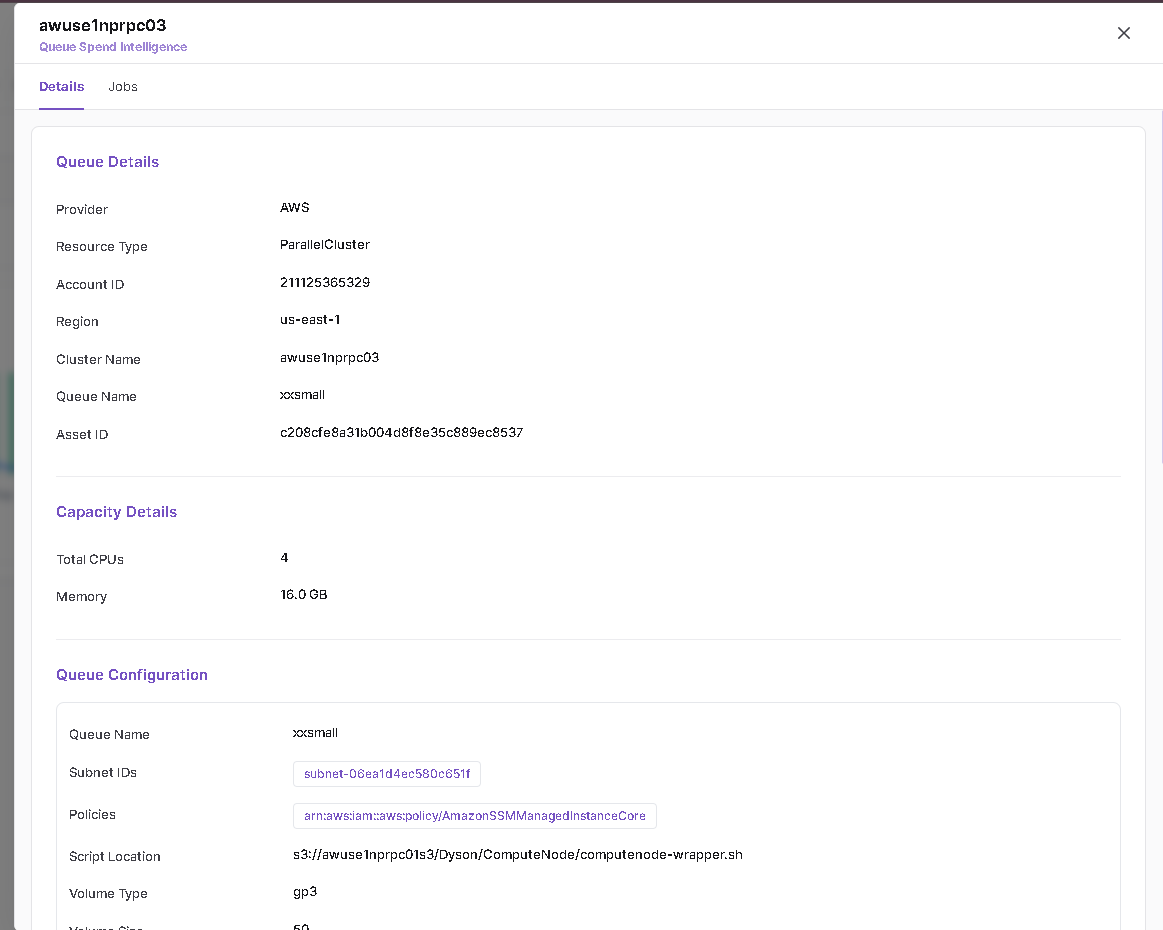
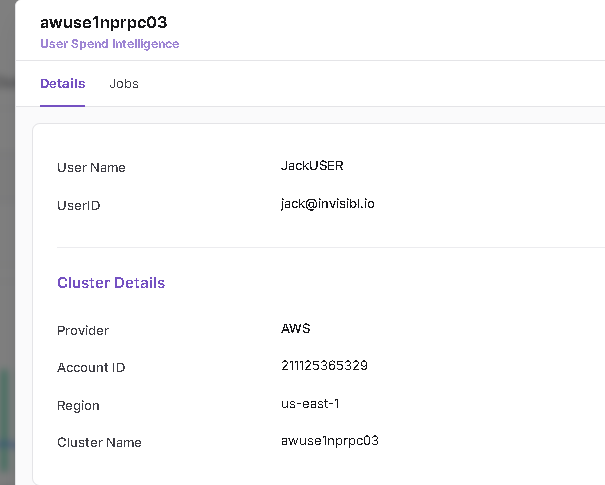
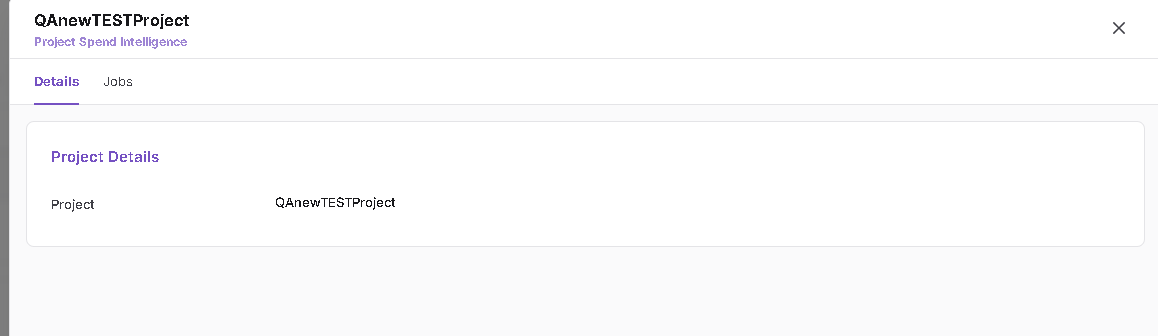
Breakdown Analysis
The Breakdown Analysis section separates spend into the cost categories available for the selected result.
Depending on the data, the legend can include categories such as:
- Storage
- Database
- Compute
- Headnode
- Others
- Workstation
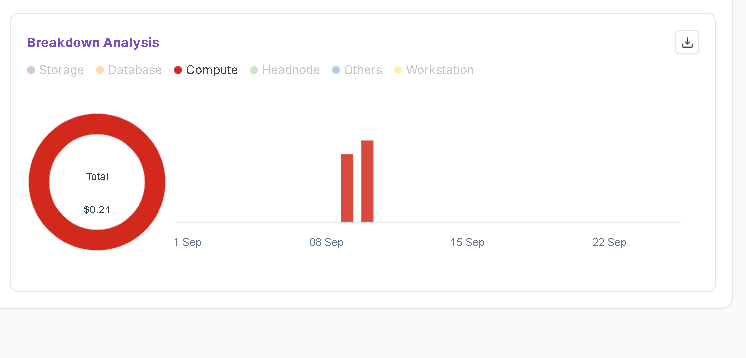
To analyse a single category:
- Locate the required category in the Breakdown Analysis legend.
- Double-click the legend item.
- The chart isolates that category and displays its cost distribution separately.
- Double-click another legend category to isolate that category instead.
Example – Storage:
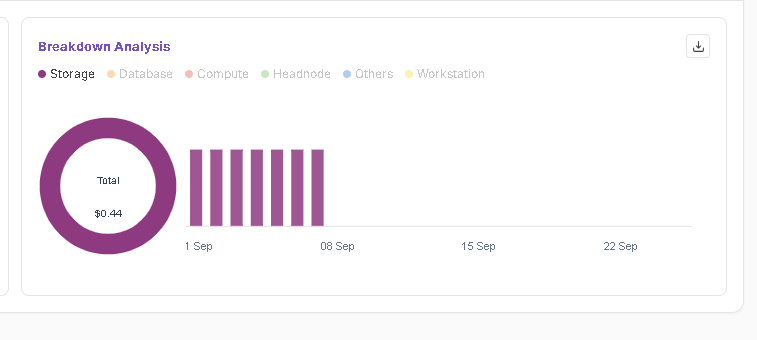
Example – Compute:
Application Spendboard
Select Type = Application to analyse spend for a specific application.
Filter by Application
- Select the required Provider, Account, and Region.
- Set Type to Application.
- Open the Application selector and select the required application.
- Select the required Cluster when cluster-level filtering is required.
- Select the date/date range.
- Click Search.


Application Spend Result
The Application result displays the selected application and resource provider together with:
- Budget vs Spend
- Trend
- Breakdown Analysis
- Time aggregation such as Daily
- View Details
- Expand/full-screen analysis
The existing Breakdown Analysis legend behaviour also applies to Application results: double-click a legend category to isolate that cost category.
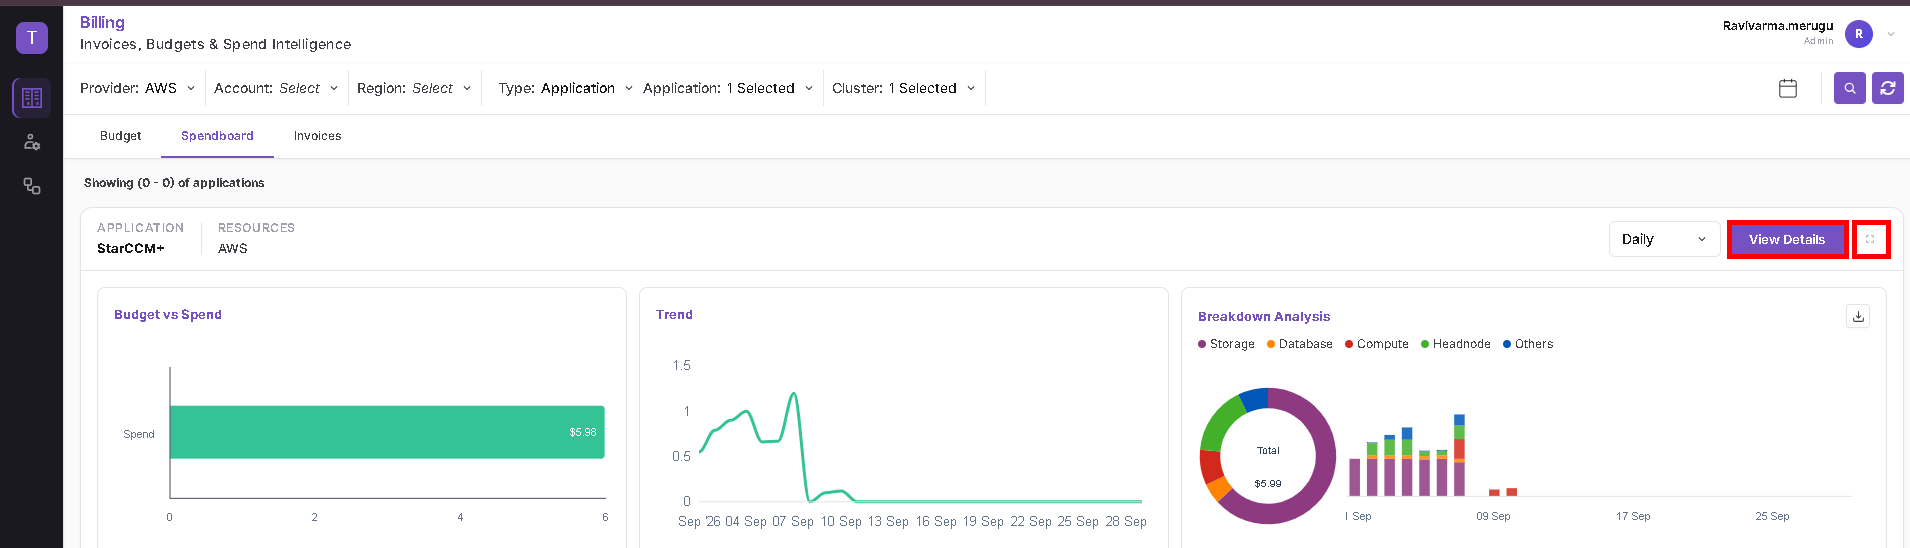
View Application Details
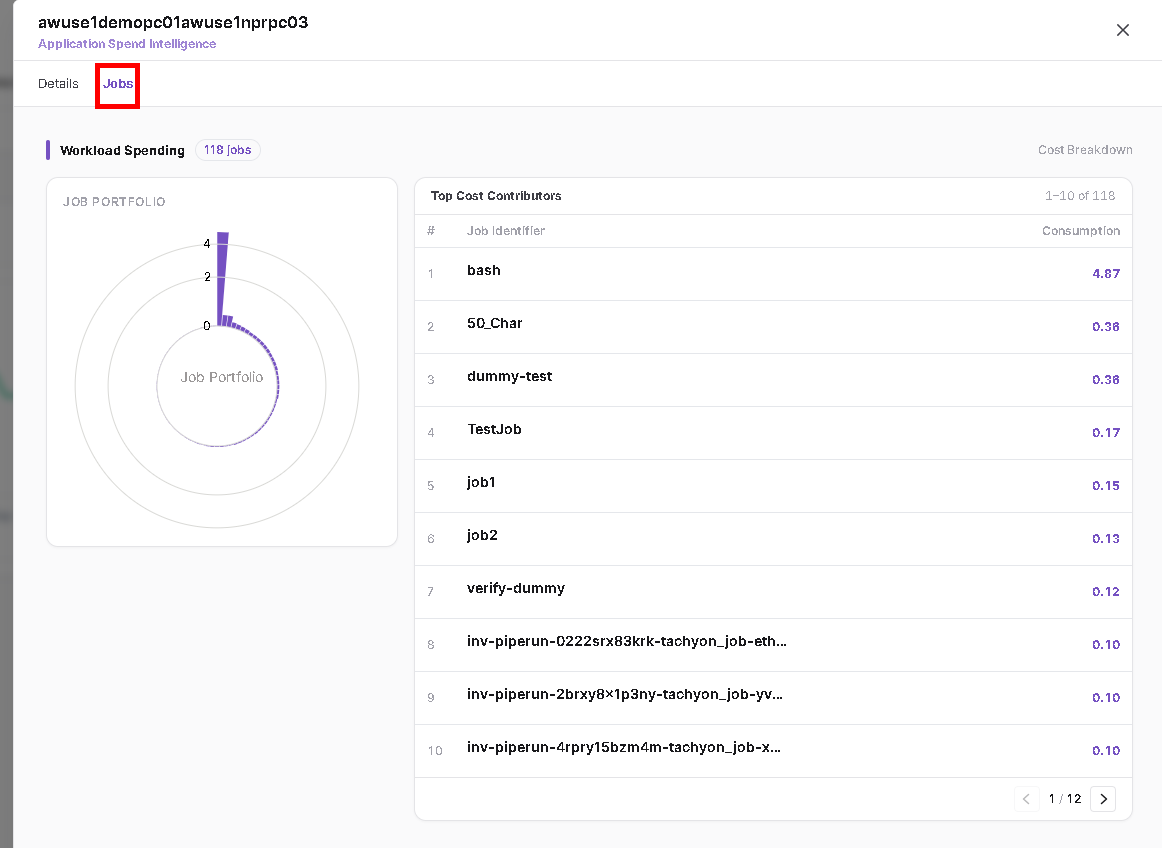
Click View Details to open Application Spend Intelligence.
The panel contains Details and Jobs tabs. Use Jobs to review workload spending, the Job Portfolio, and the top cost-contributing jobs with their consumption values.
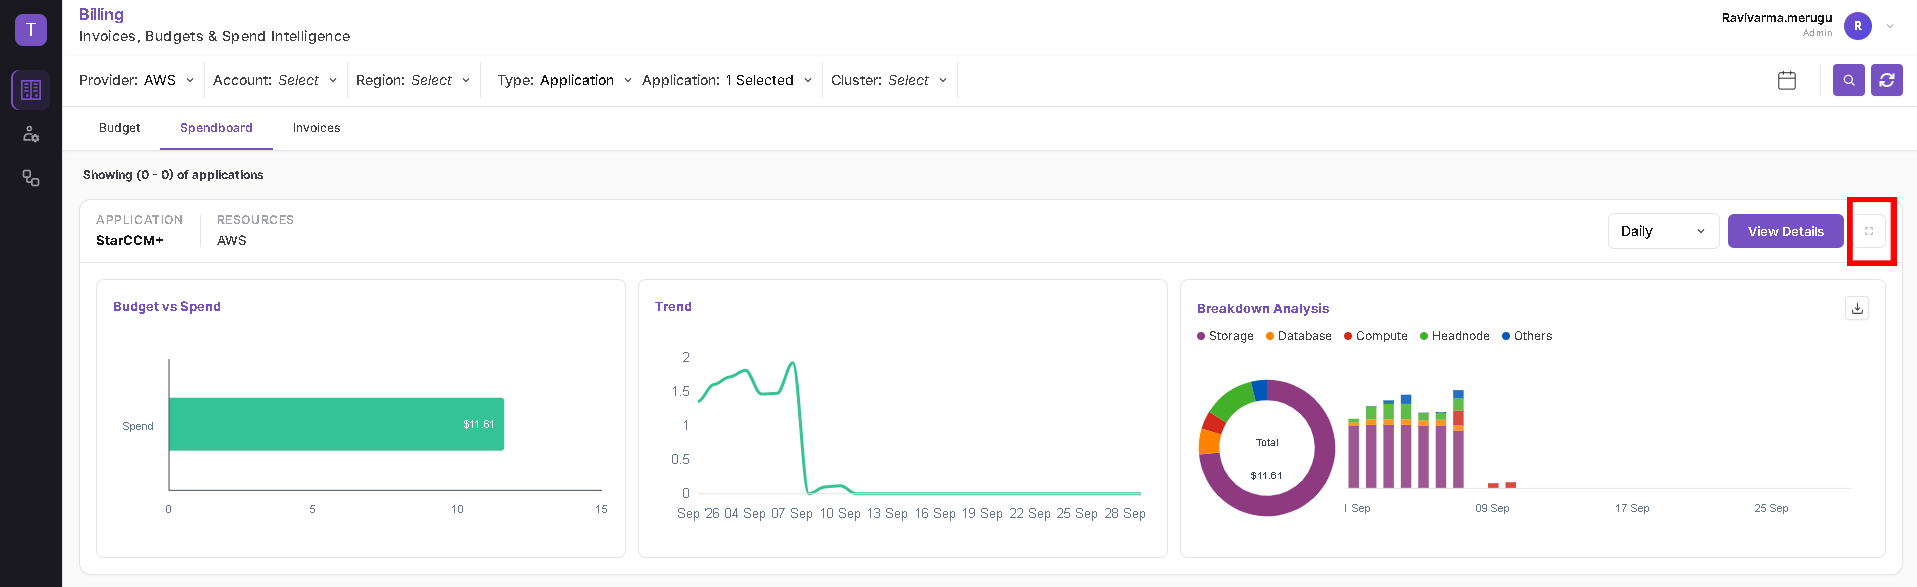
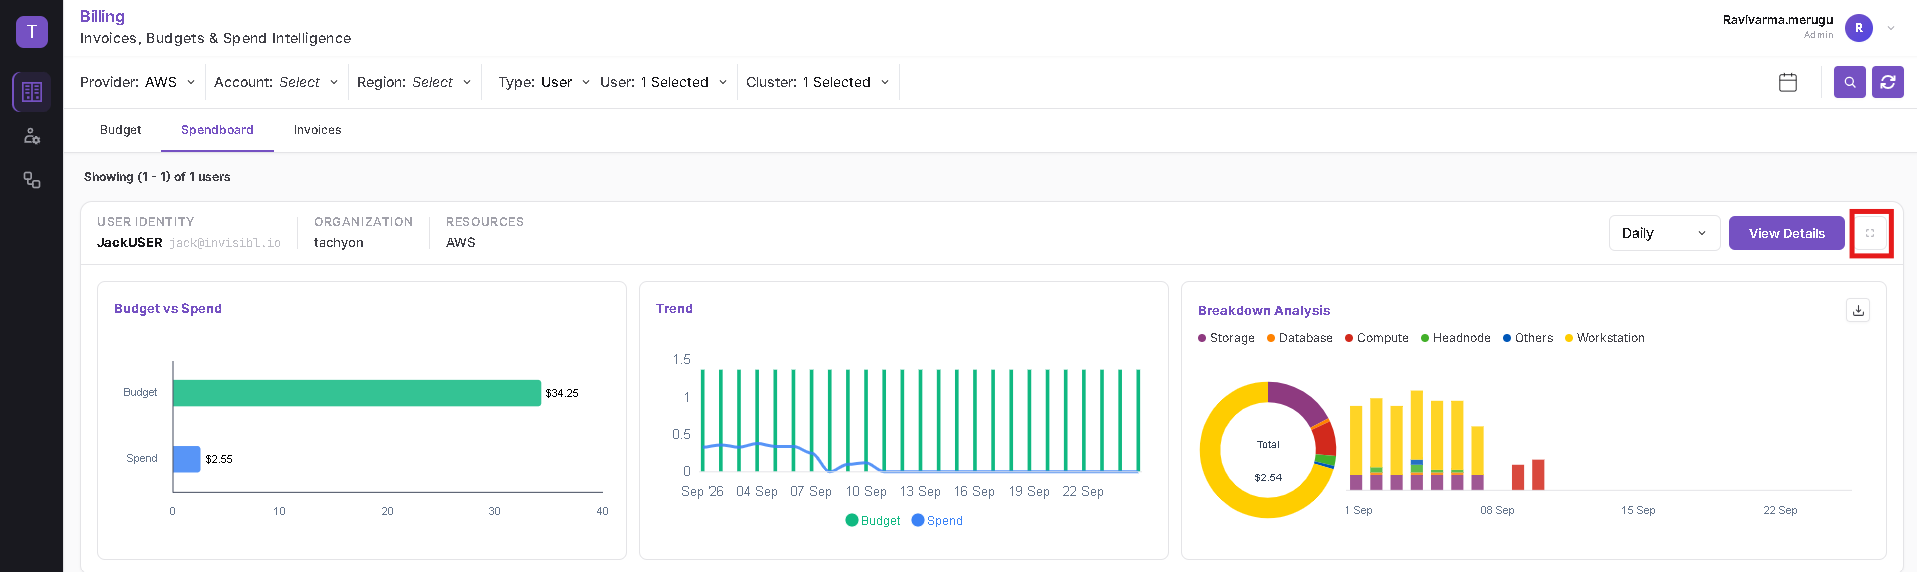
Expand Application Analysis
Click the Expand icon on the Application result to open the detailed analysis.
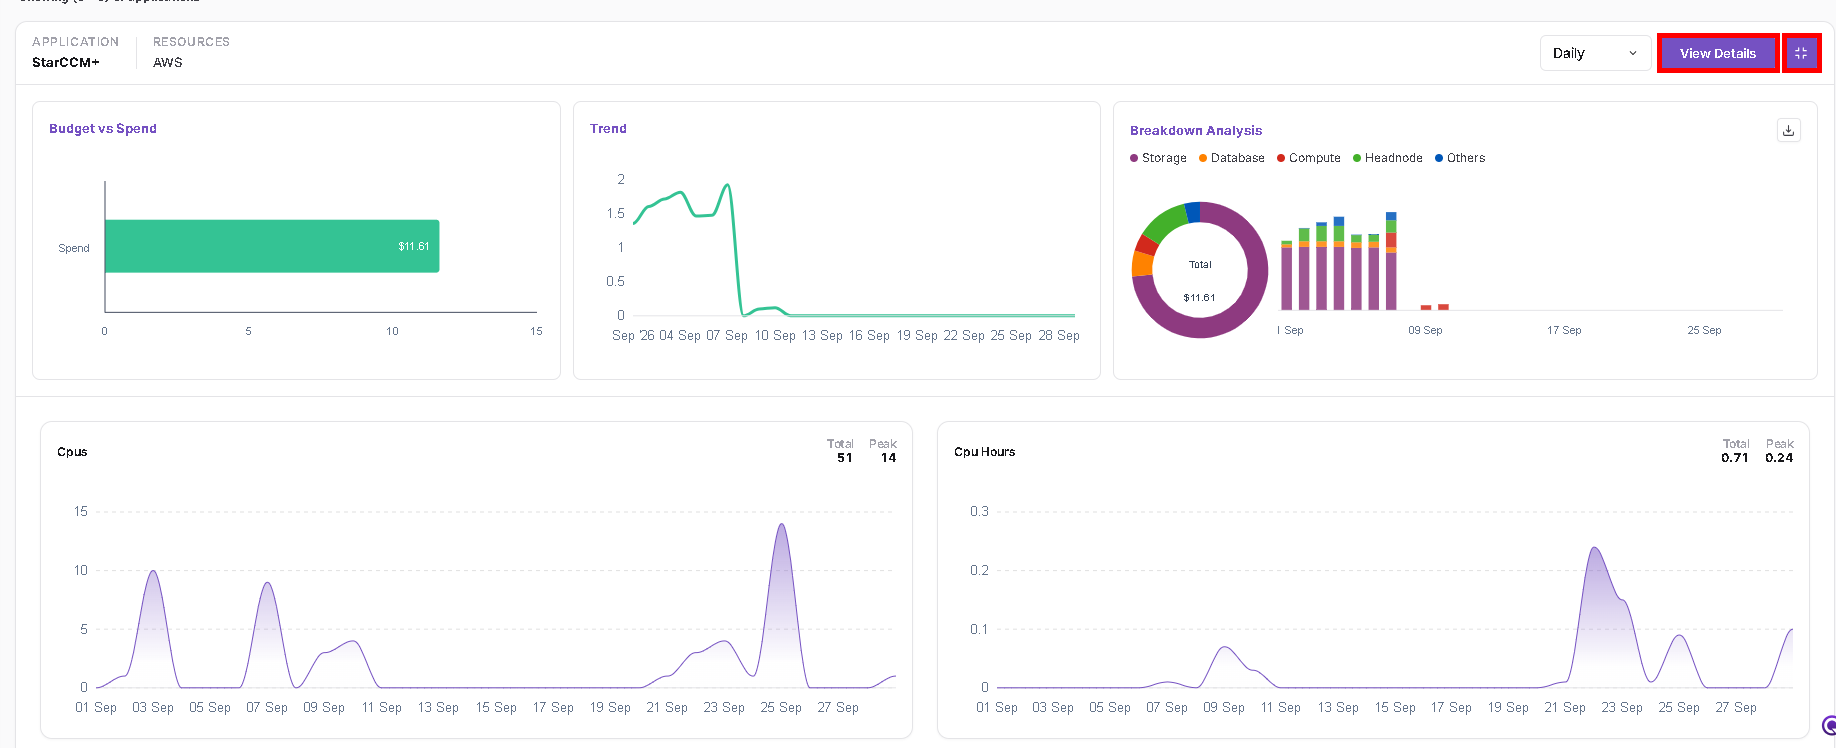
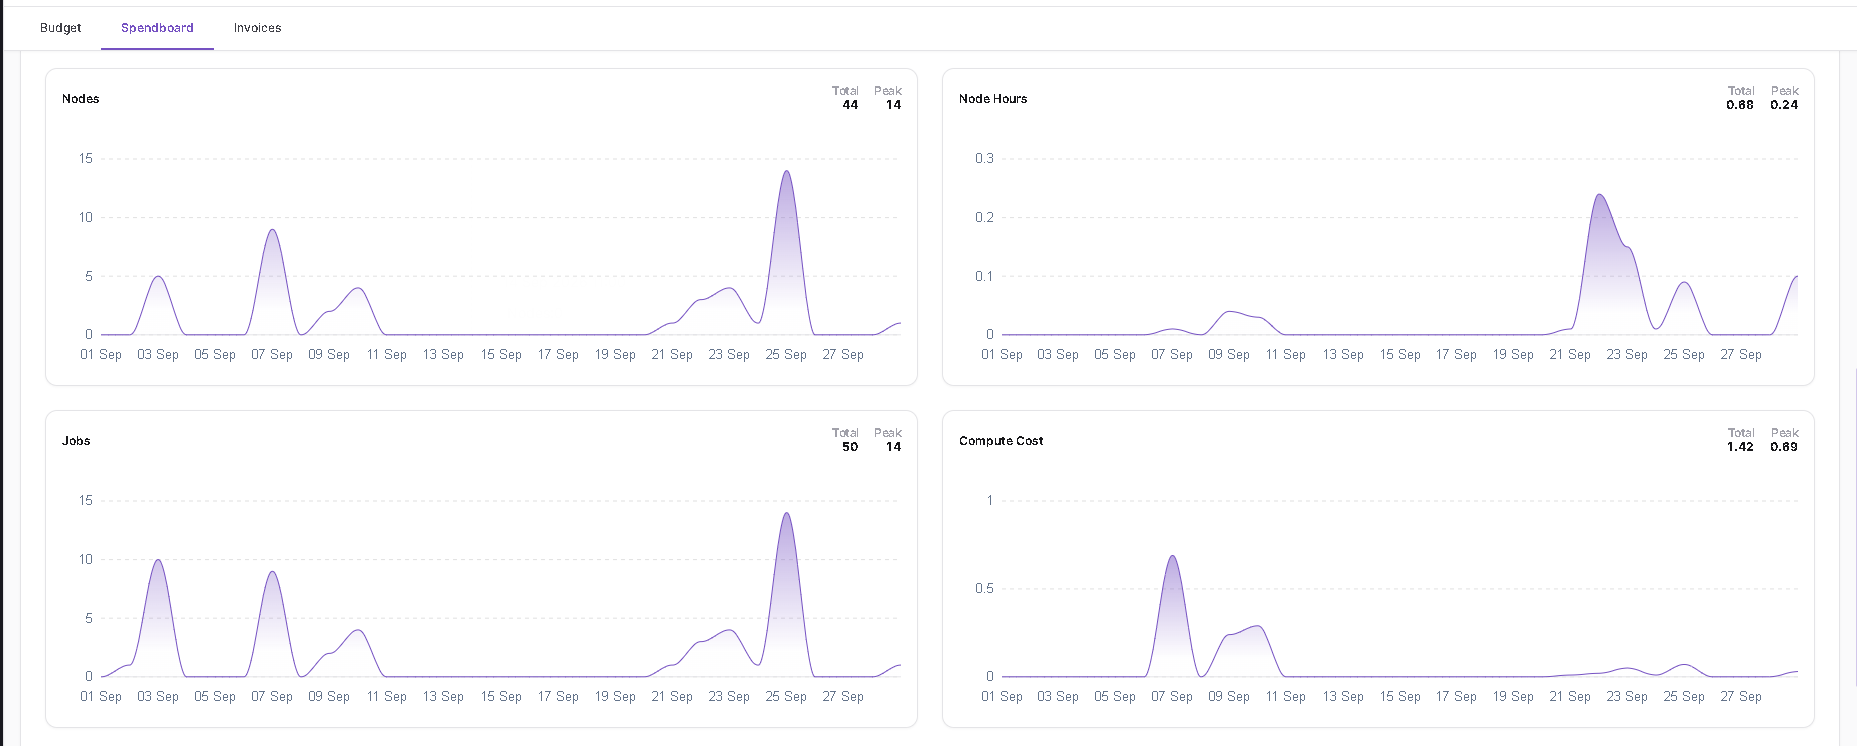
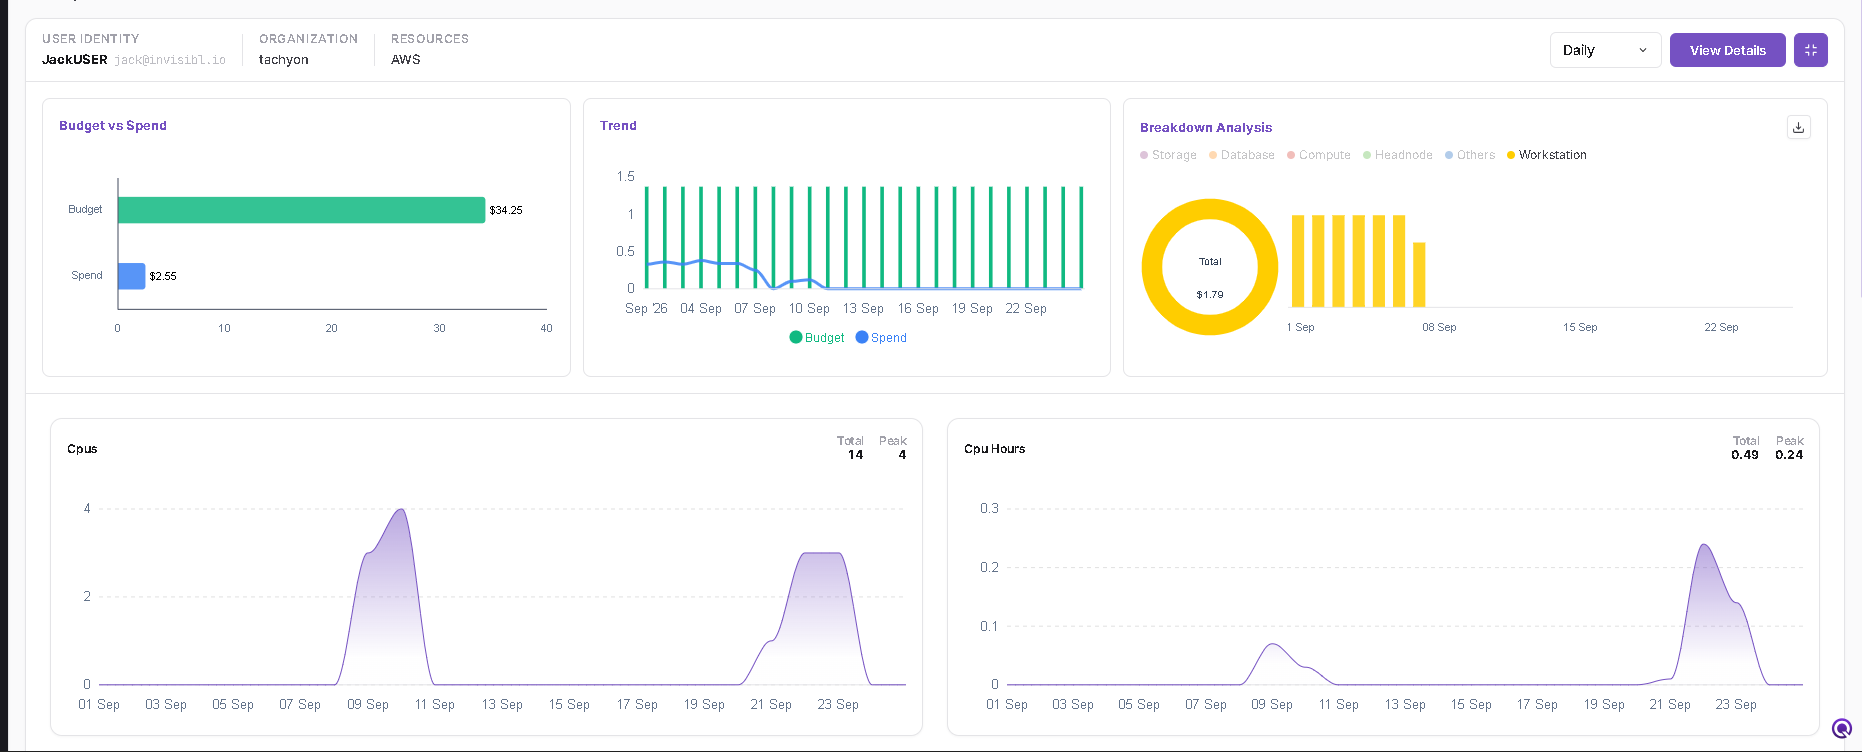
The expanded view includes the standard Spendboard summary and additional application resource metrics, including:
- CPUs
- CPU Hours
- Nodes
- Node Hours
- Jobs
- Compute Cost
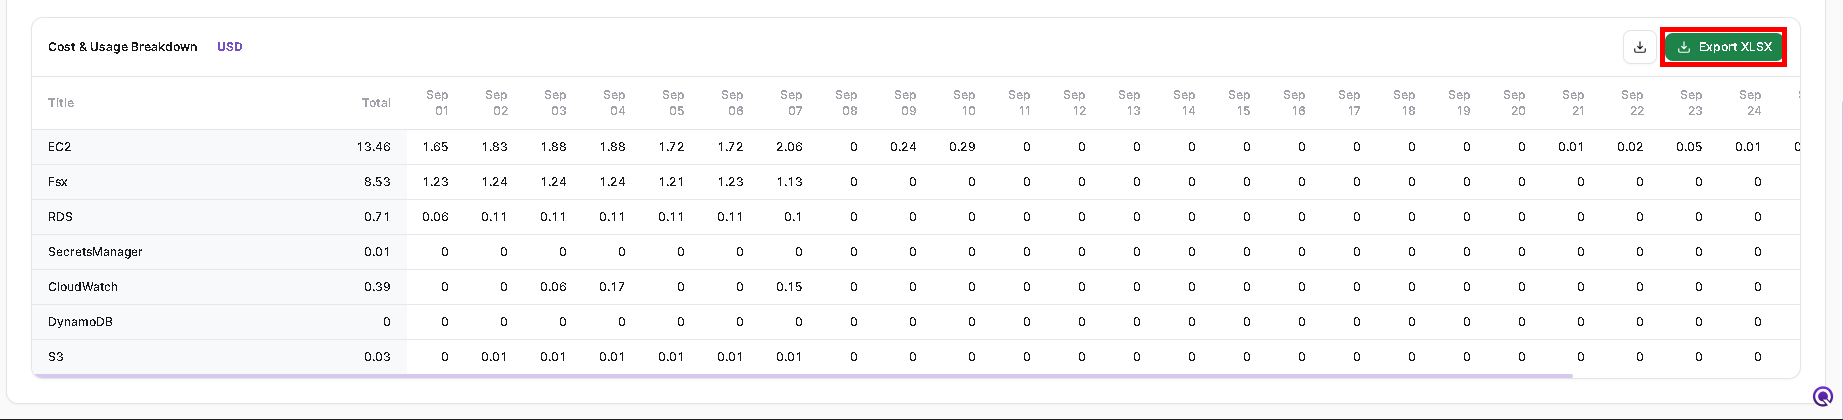
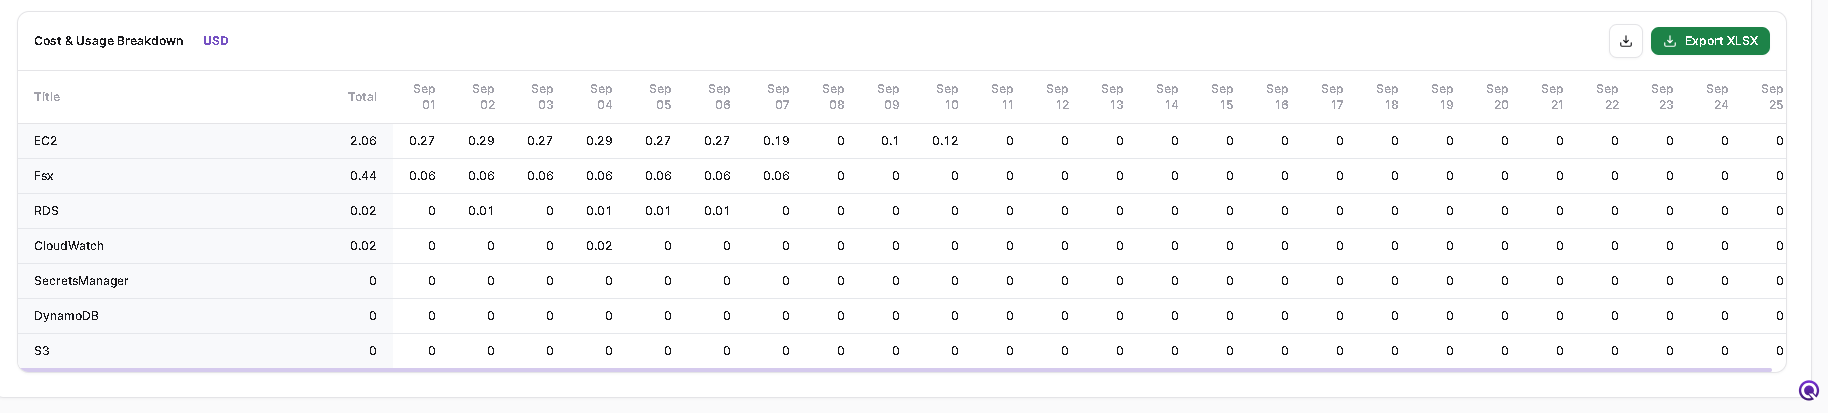
Cost & Usage Breakdown
Scroll to Cost & Usage Breakdown to review the date-wise service costs for the selected Application result.
The table can include services such as EC2, FSx, RDS, Secrets Manager, CloudWatch, DynamoDB, and S3 depending on the usage data.
Click Export XLSX to export the Cost & Usage Breakdown.
Expand Spendboard Analysis
Use the Expand icon on the required result when a larger analysis view is needed.
- Click the Expand icon.
- Review the expanded Budget vs Spend, Trend, and Breakdown Analysis.
- Review the additional spend charts shown below the summary.
- Scroll to the Cost & Usage Breakdown table for the detailed date-wise cost values.
- The result heading and detail fields change according to the selected Type.
- Double-clicking a Breakdown Analysis legend item isolates that cost category.
- Application results support View Details, expanded resource metrics, and Cost & Usage Breakdown export.