Dashboard - Project View
Use the administrator Dashboard's Project view to review a project's activity, costs, and resource consumption for the selected cluster filters and reporting period.
The screenshots use QAnewTESTProject (QANEW001) as an example. Select the project relevant to your work; its results can differ from the values shown here.
Select a Project and Reporting Period
- Open HPC > Dashboard and set Type to Project.
- Select the required Provider, Account, and Region.
- Open Project and select the required item using its checkbox. The example uses QAnewTESTProject (QANEW001).
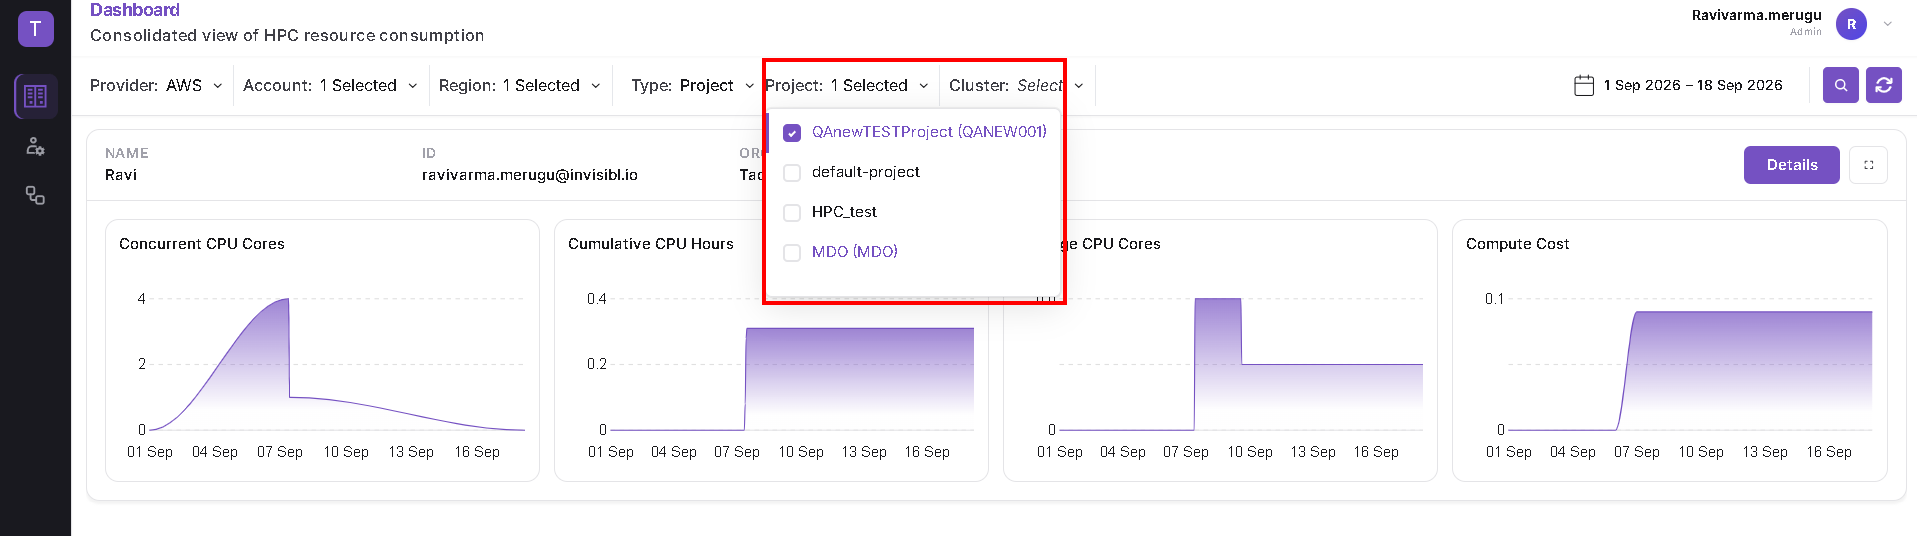
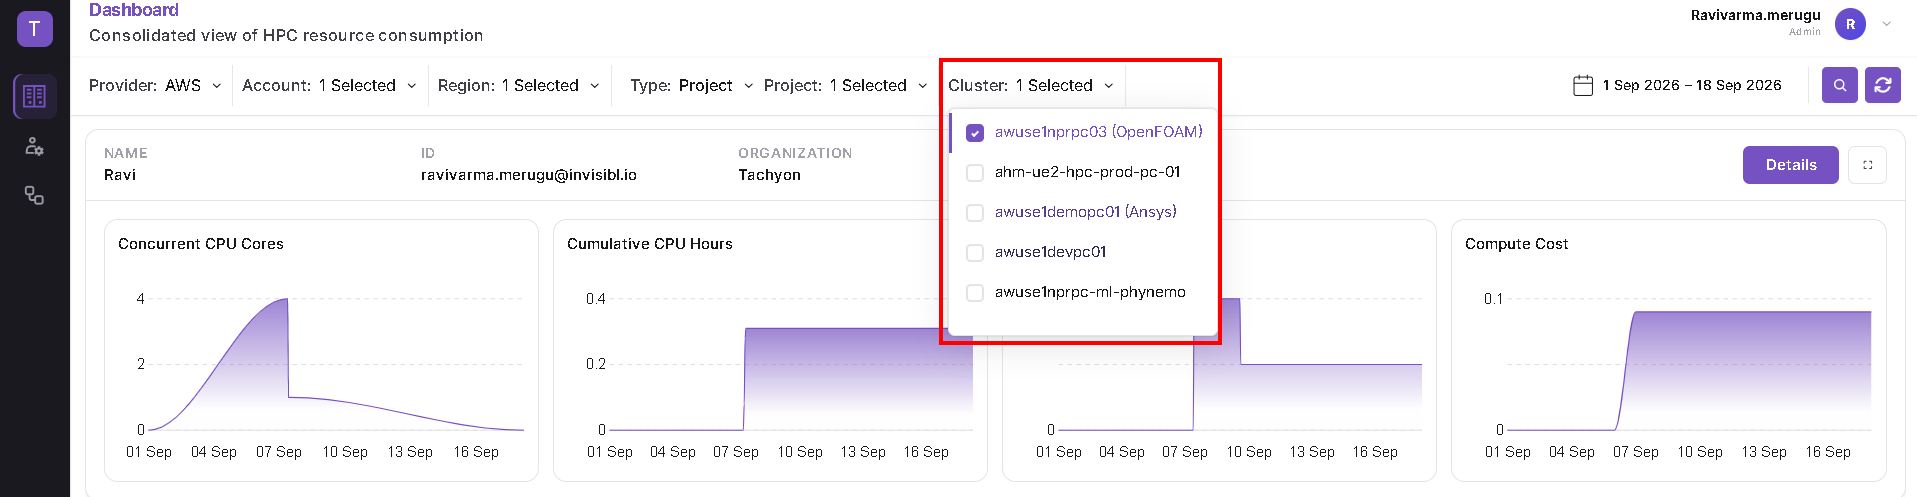
- Open Cluster and select the relevant cluster. The example uses awuse1nprpc03 (OpenFOAM).
- Open the calendar, select the reporting dates, and click Apply.
- Click the Search button beside the calendar to retrieve the results.
See Choose Dates and Retrieve Results for the shared calendar controls. The selection screenshots above show the state before Search; previously loaded cards can still be visible. Click Search again after changing the filters or dates.
Read the Project Card
The card shows the PROJECT name and RESOURCES provider. The example displays QAnewTESTProject and AWS.
The four summary charts are Concurrent CPU Cores, Cumulative CPU Hours, Average CPU Cores, and Compute Cost. Values reflect the selected filters and reporting period.
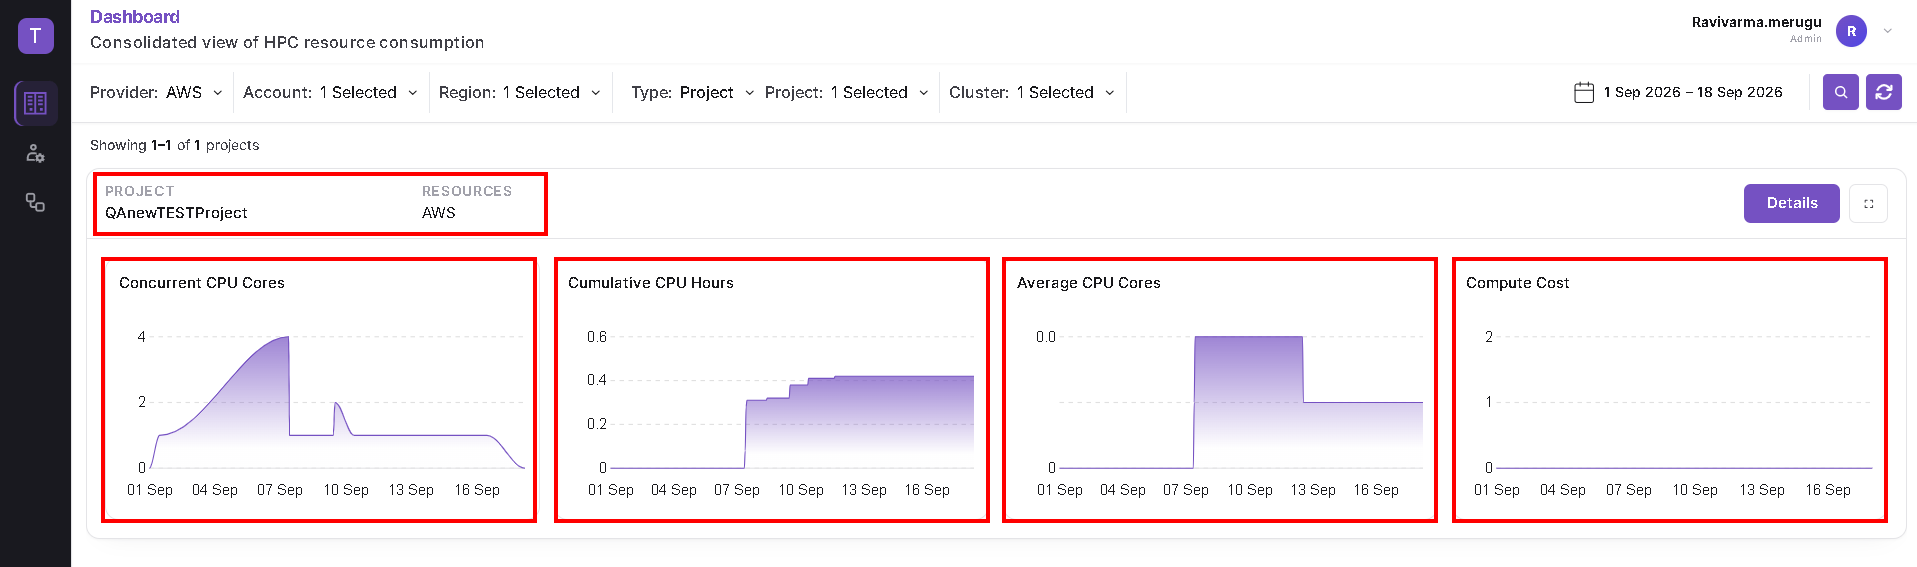
Use Details to open Project Details. Use the separate small expand icon immediately beside it to open the selected project's detailed metrics.
Open Project Details
Click Details on the project card. The current Project Details window displays the Project name.
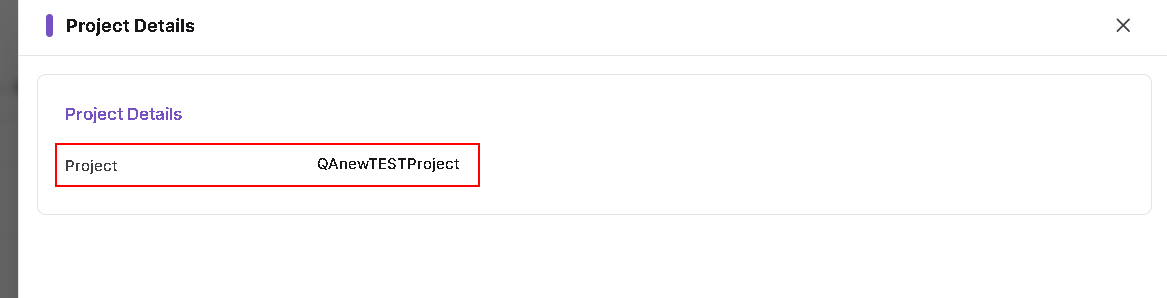
Use X to close Project Details and return to the project's card.
Open the Expanded Metrics View
- Close Project Details using X if it is open.
- On the same project card, click the small expand icon beside Details.
- Confirm the window title identifies the selected project, then scroll through the sections below.
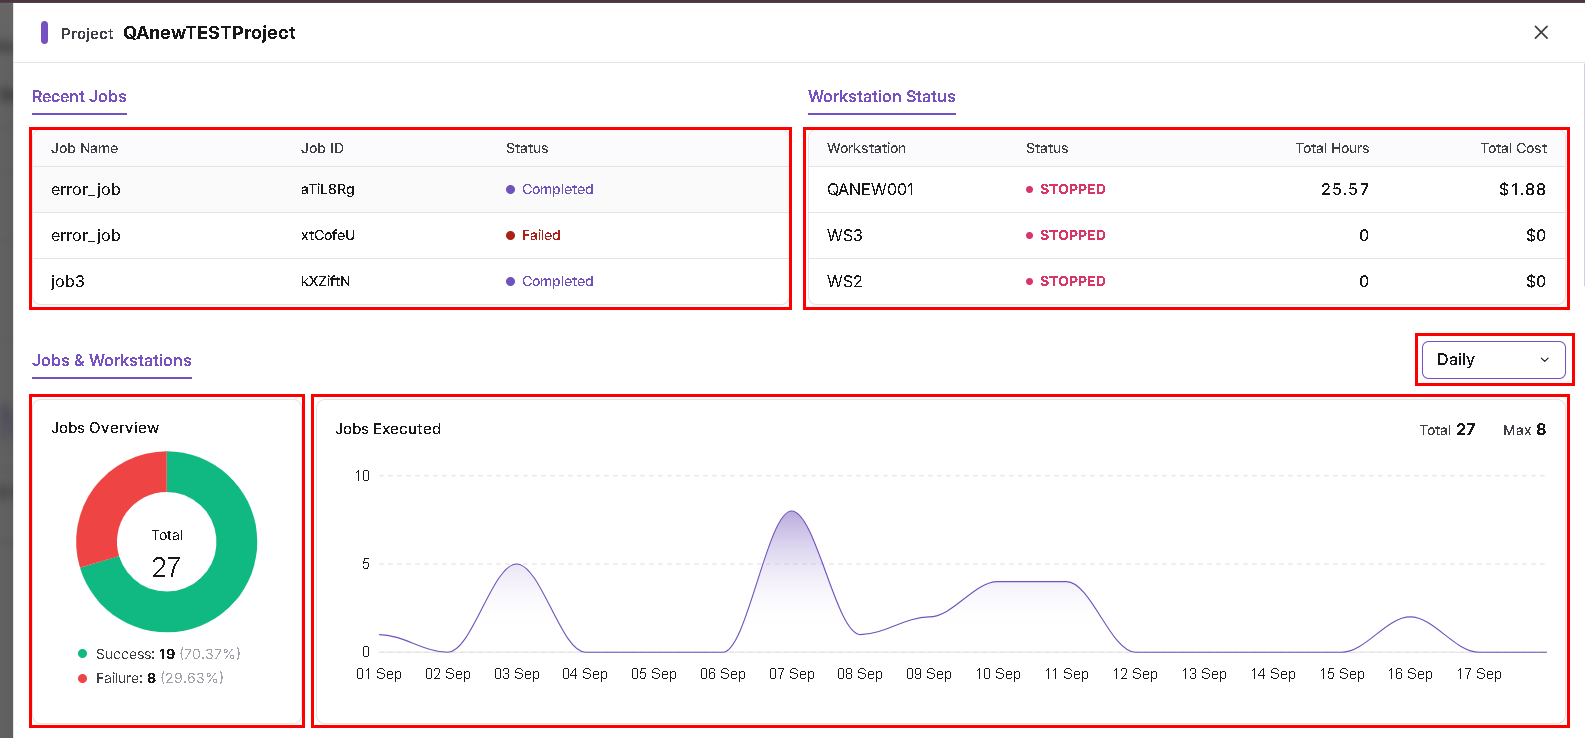
Recent Jobs and Workstation Status
Recent Jobs lists Job Name, Job ID, and Status.
Workstation Status lists Workstation, Status, Total Hours, and Total Cost.
Jobs & Workstations
Jobs Overview shows total jobs and their success/failure breakdown. Jobs Executed shows the execution trend, with total and maximum values above the chart. The interval dropdown shows Daily in this example.
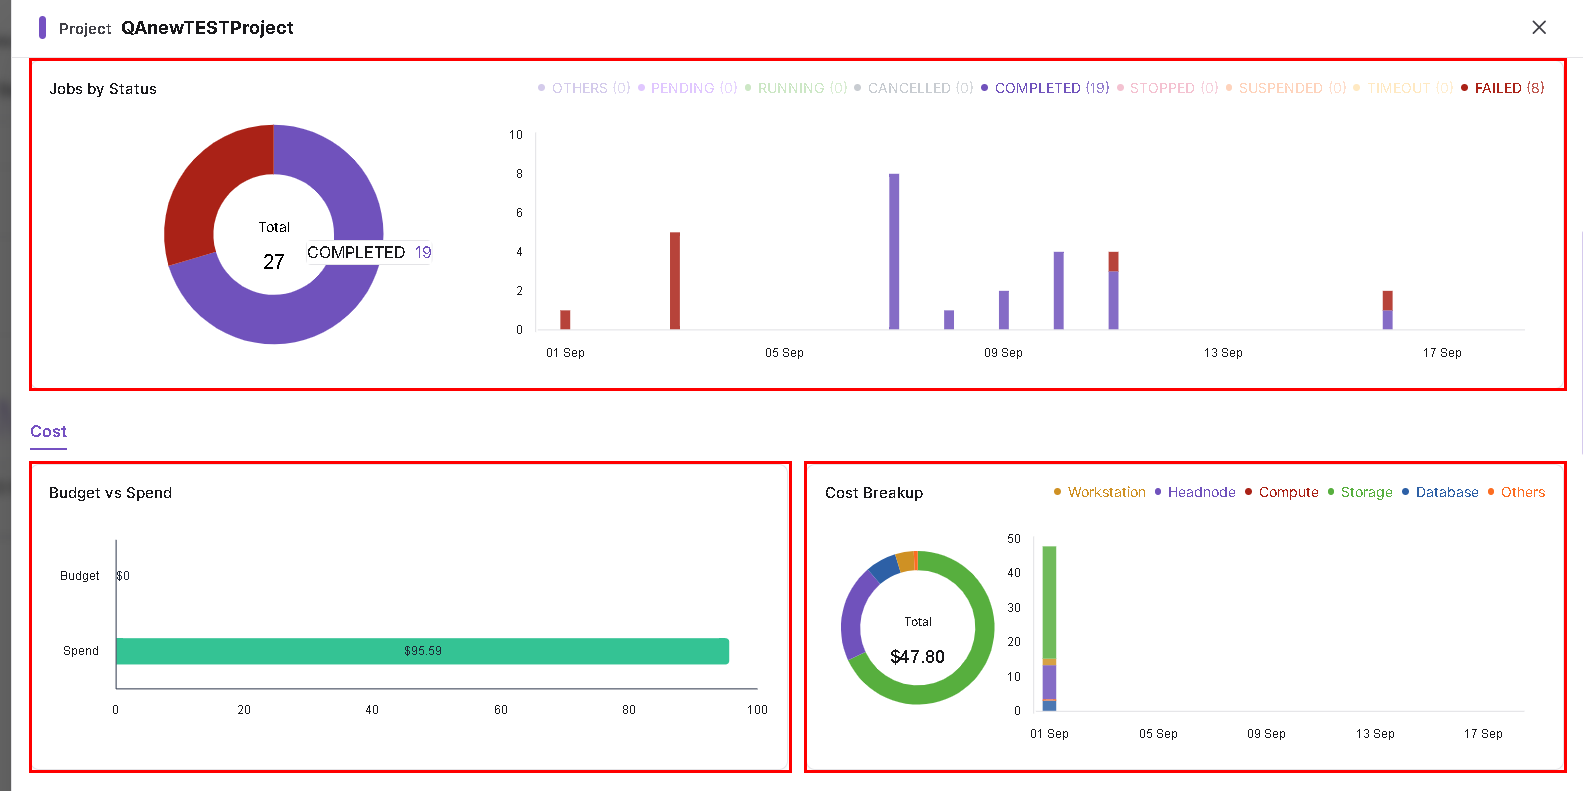
Scroll down to Jobs by Status to review the status distribution and its trend. The legend identifies the statuses represented.
Cost
Budget vs Spend compares the displayed budget and spend.
Cost Breakup shows the cost distribution and trend. Its legend includes Workstation, Headnode, Compute, Storage, Database, and Others.
Resources
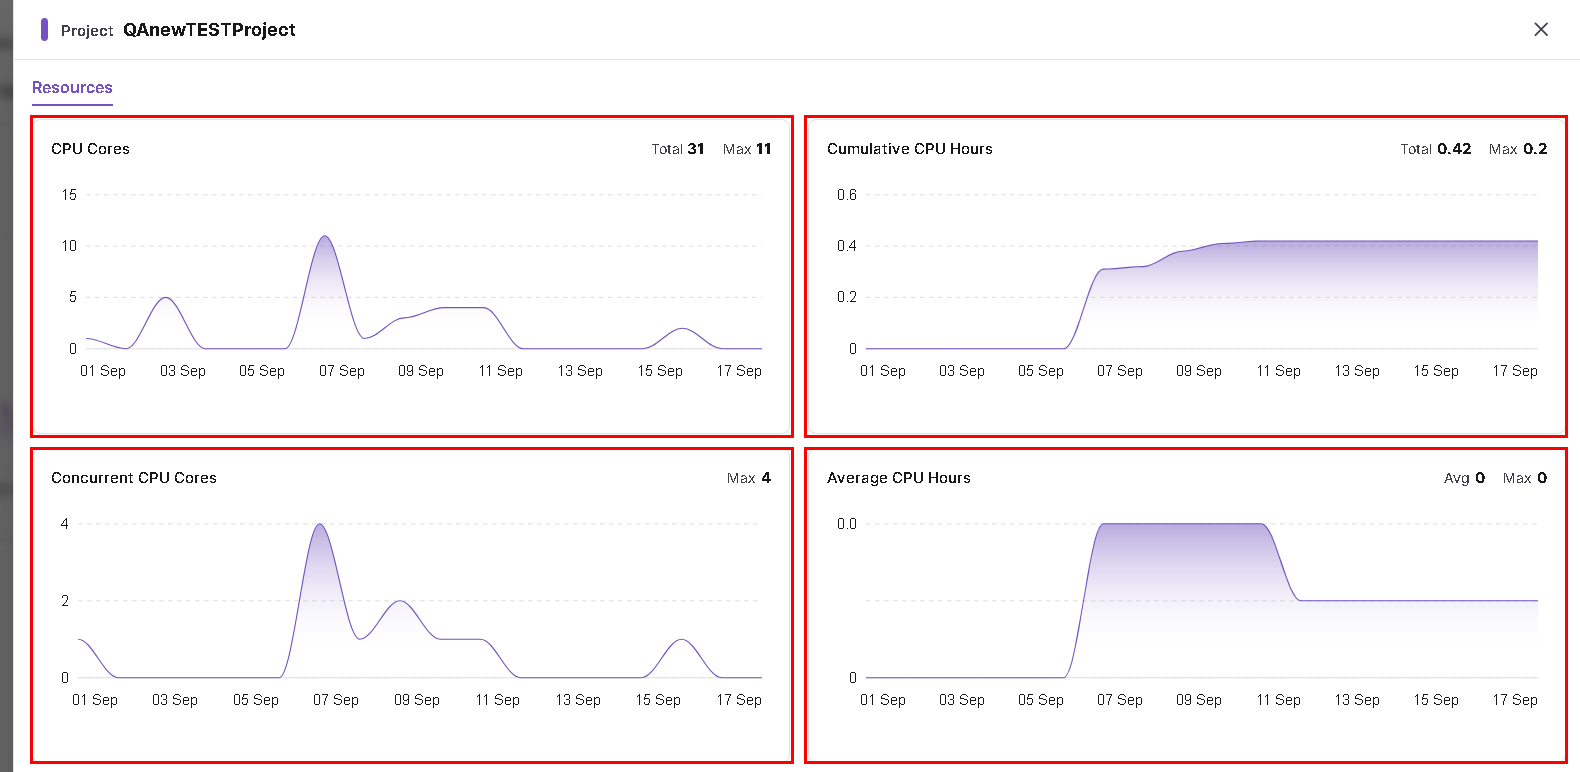
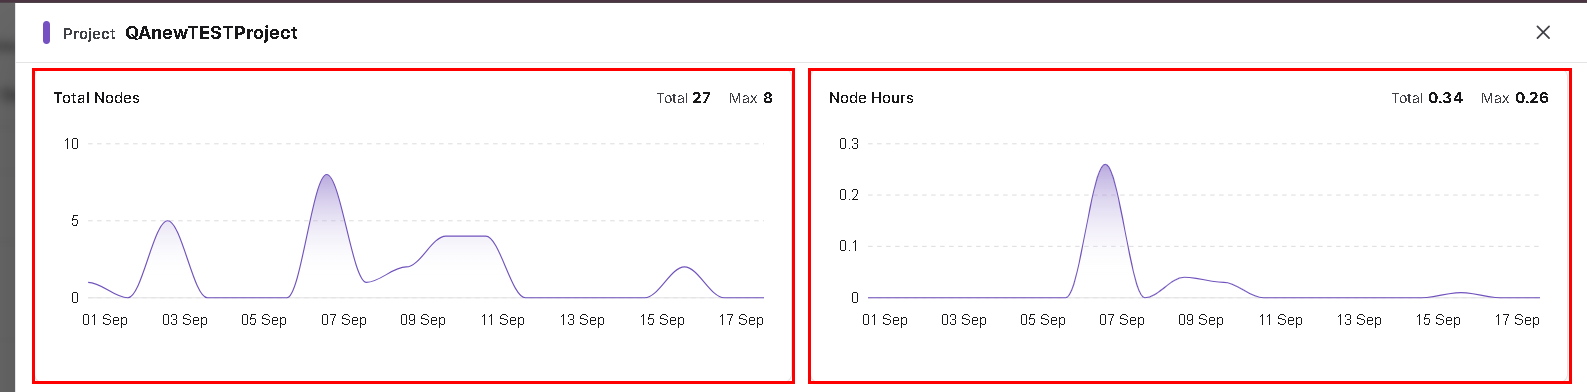
Review the following charts and the totals, maximums, or averages displayed on each:
- CPU Cores
- Cumulative CPU Hours
- Concurrent CPU Cores
- Average CPU Hours
- Total Nodes
- Node Hours
The expanded view uses the label Average CPU Hours, while the summary card uses Average CPU Cores. Hover over a data point to inspect its timestamp and value.
Resource Report Table
Scroll below the charts to review the daily report for the selected project.
| Category | Columns |
|---|---|
| Date and activity | Date, Jobs Executed |
| Cost | Total Cost, Workstation Cost, Compute Cost |
| CPU | CPU Cores, Average CPU Hours, Concurrent CPU Cores, Cumulative CPU Hours |
| Nodes | Total Nodes, Node Hours |
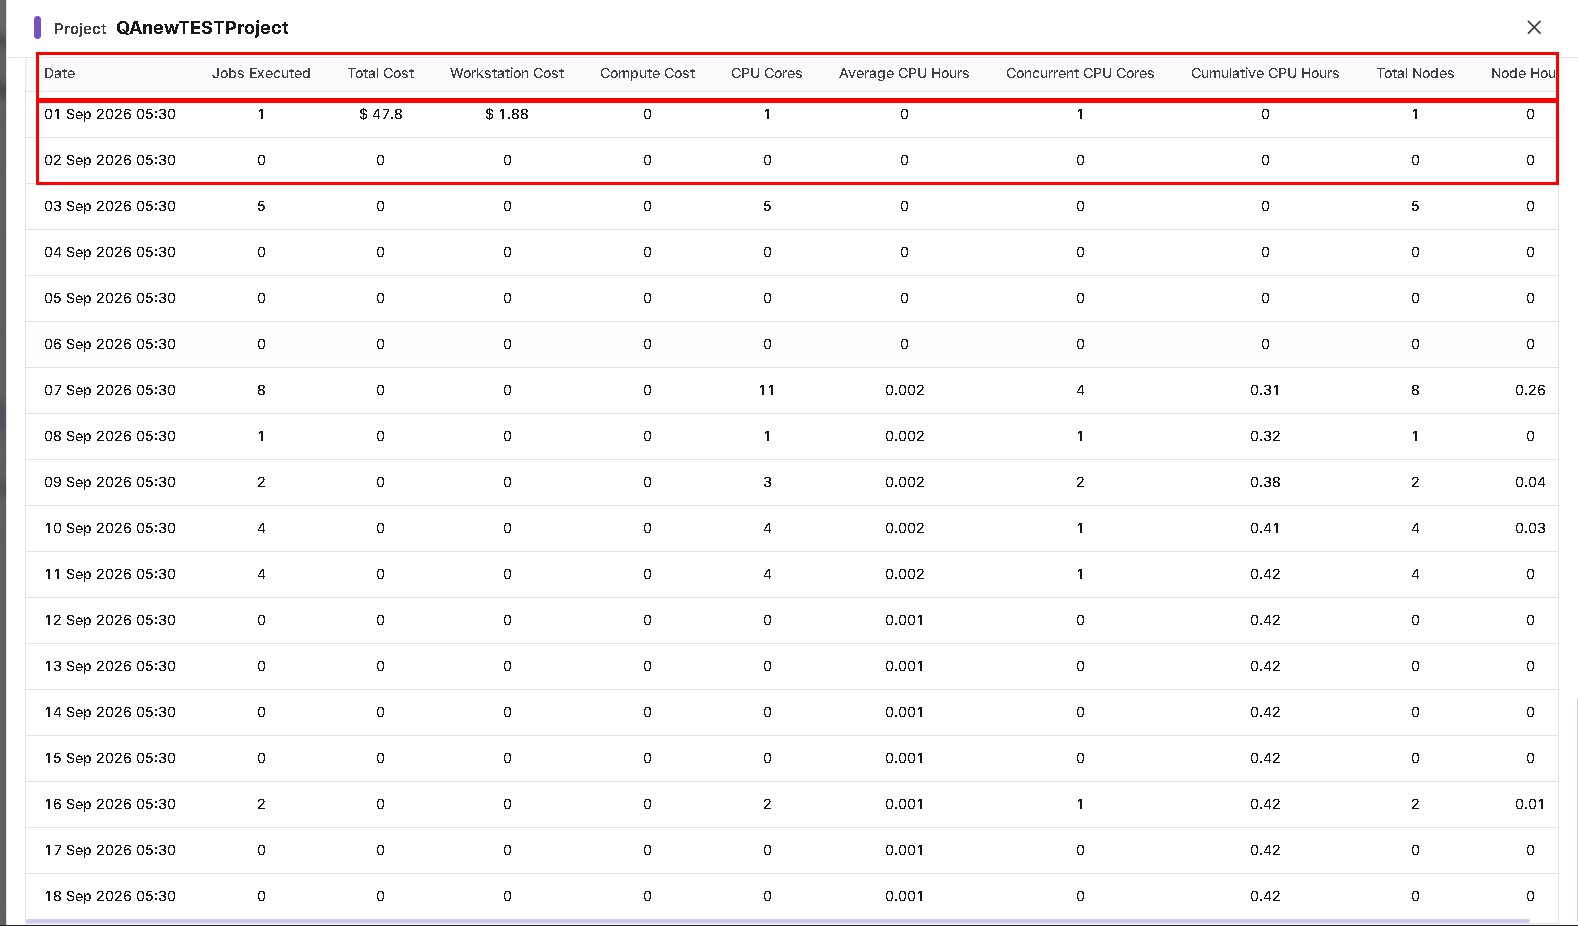
Use the table's horizontal scrollbar if needed to see the remaining columns. Close the expanded window using X at the top right to return to the Dashboard.