Dashboard - Cluster View
Use the administrator Dashboard's Cluster view to review cluster resource consumption, inspect configuration details, and examine job, workstation, and cost information.
The screenshots use awuse1nprpc03 as an example. Select the cluster relevant to your work; the number of clusters, queues, resources, and reported values can differ.
Select a Cluster and Reporting Period
- Open HPC > Dashboard.
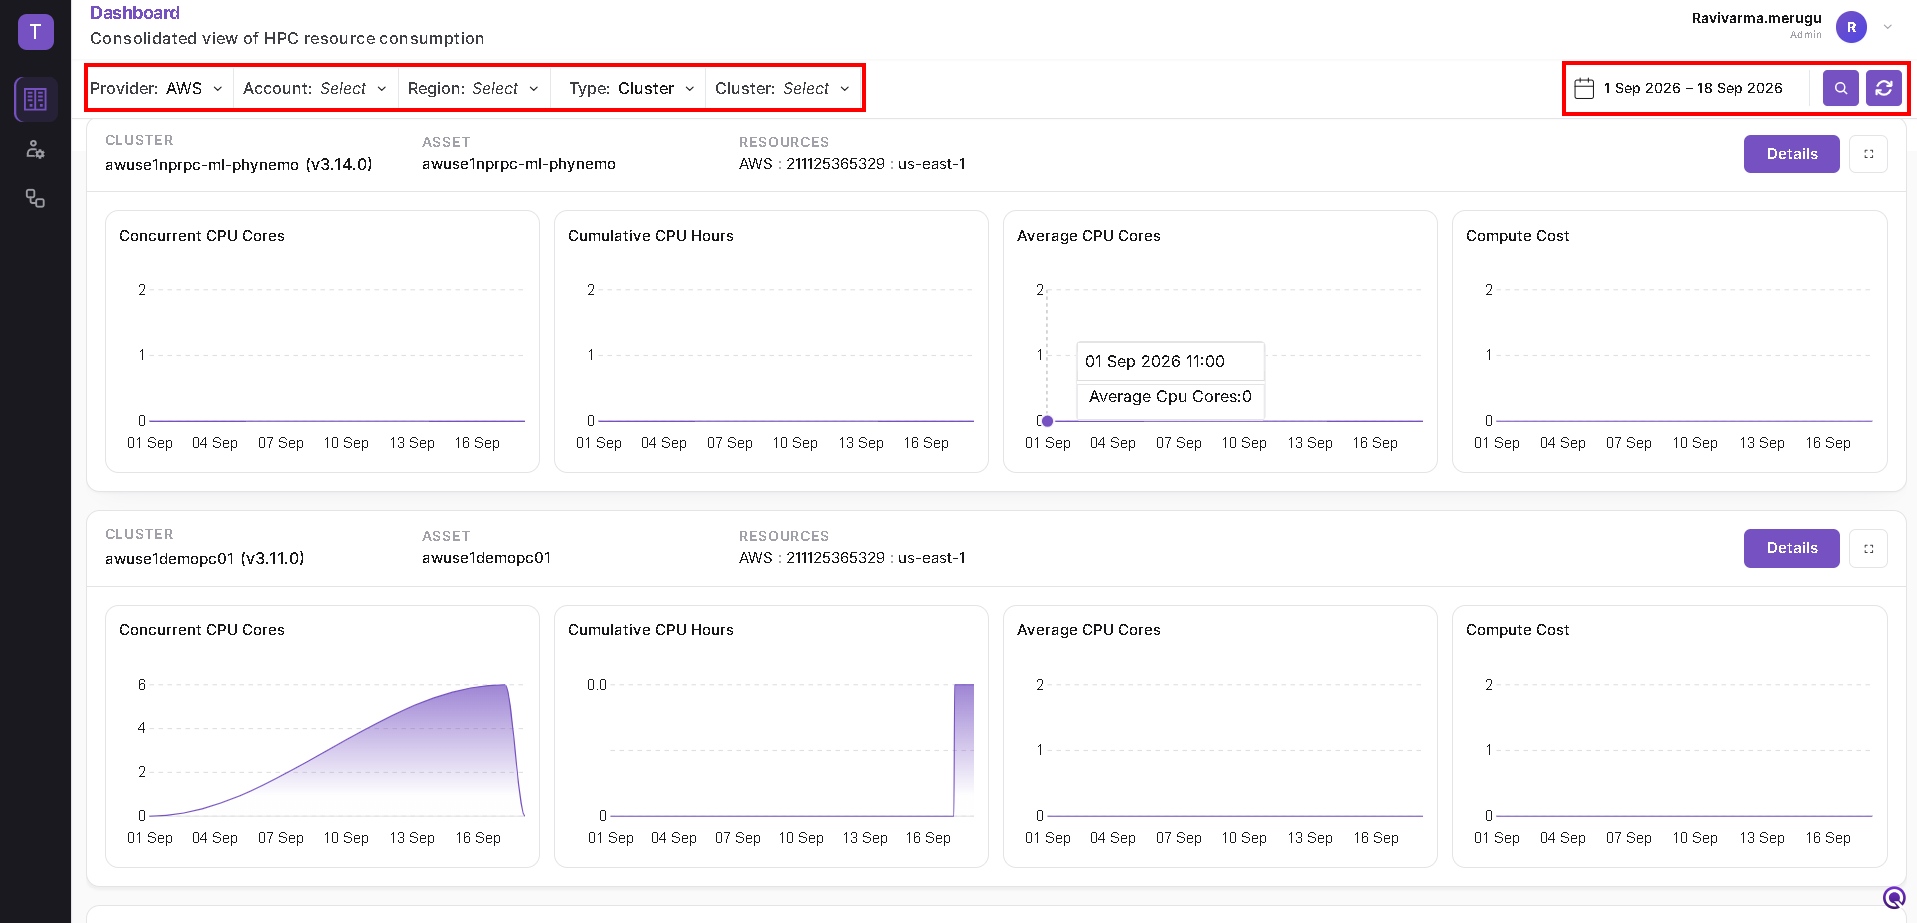
- Set Type to Cluster.
- Select the required Provider, Account, Region, and Cluster filters.
- Open the calendar, choose the date range, and click Apply.
- Click the Search icon beside the calendar to retrieve the results.
See Choose Dates and Retrieve Results for the shared calendar steps. Click Search again after changing filters or dates.
When multiple cluster cards are displayed, scroll to the required card. Use the Refresh icon to reload the data.
Read the Cluster Card
| Area | Information shown |
|---|---|
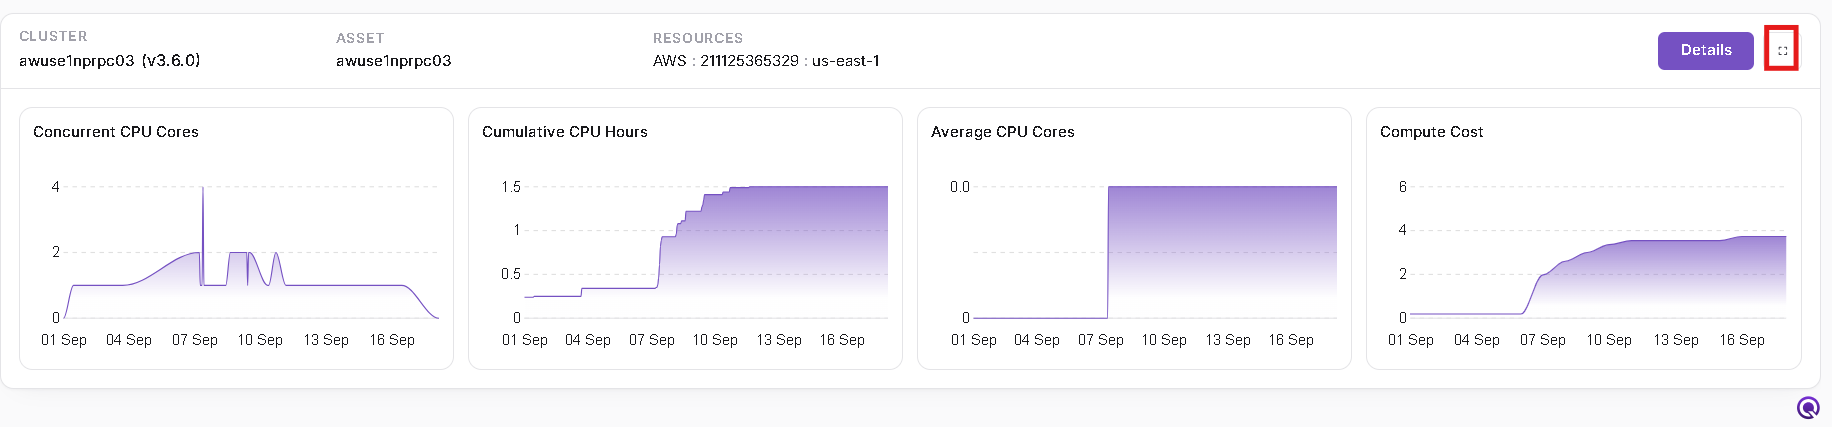
| CLUSTER | Cluster name and version. |
| ASSET | Associated asset name. |
| RESOURCES | Provider, cloud account ID, and region. |
| Concurrent CPU Cores | CPU cores used concurrently over time. |
| Cumulative CPU Hours | Accumulated CPU hours over time. |
| Average CPU Cores | Average CPU core usage shown for the reporting period. |
| Compute Cost | Compute cost trend for the cluster. |
Hover over a chart to inspect the date and value of a data point.
Each card provides two actions:
- Details opens the Cluster Details window.
- The expand icon beside Details opens the cluster's detailed metrics window.
Open Cluster Details
Click Details on the required cluster card. The highlighted button below belongs to the example cluster.
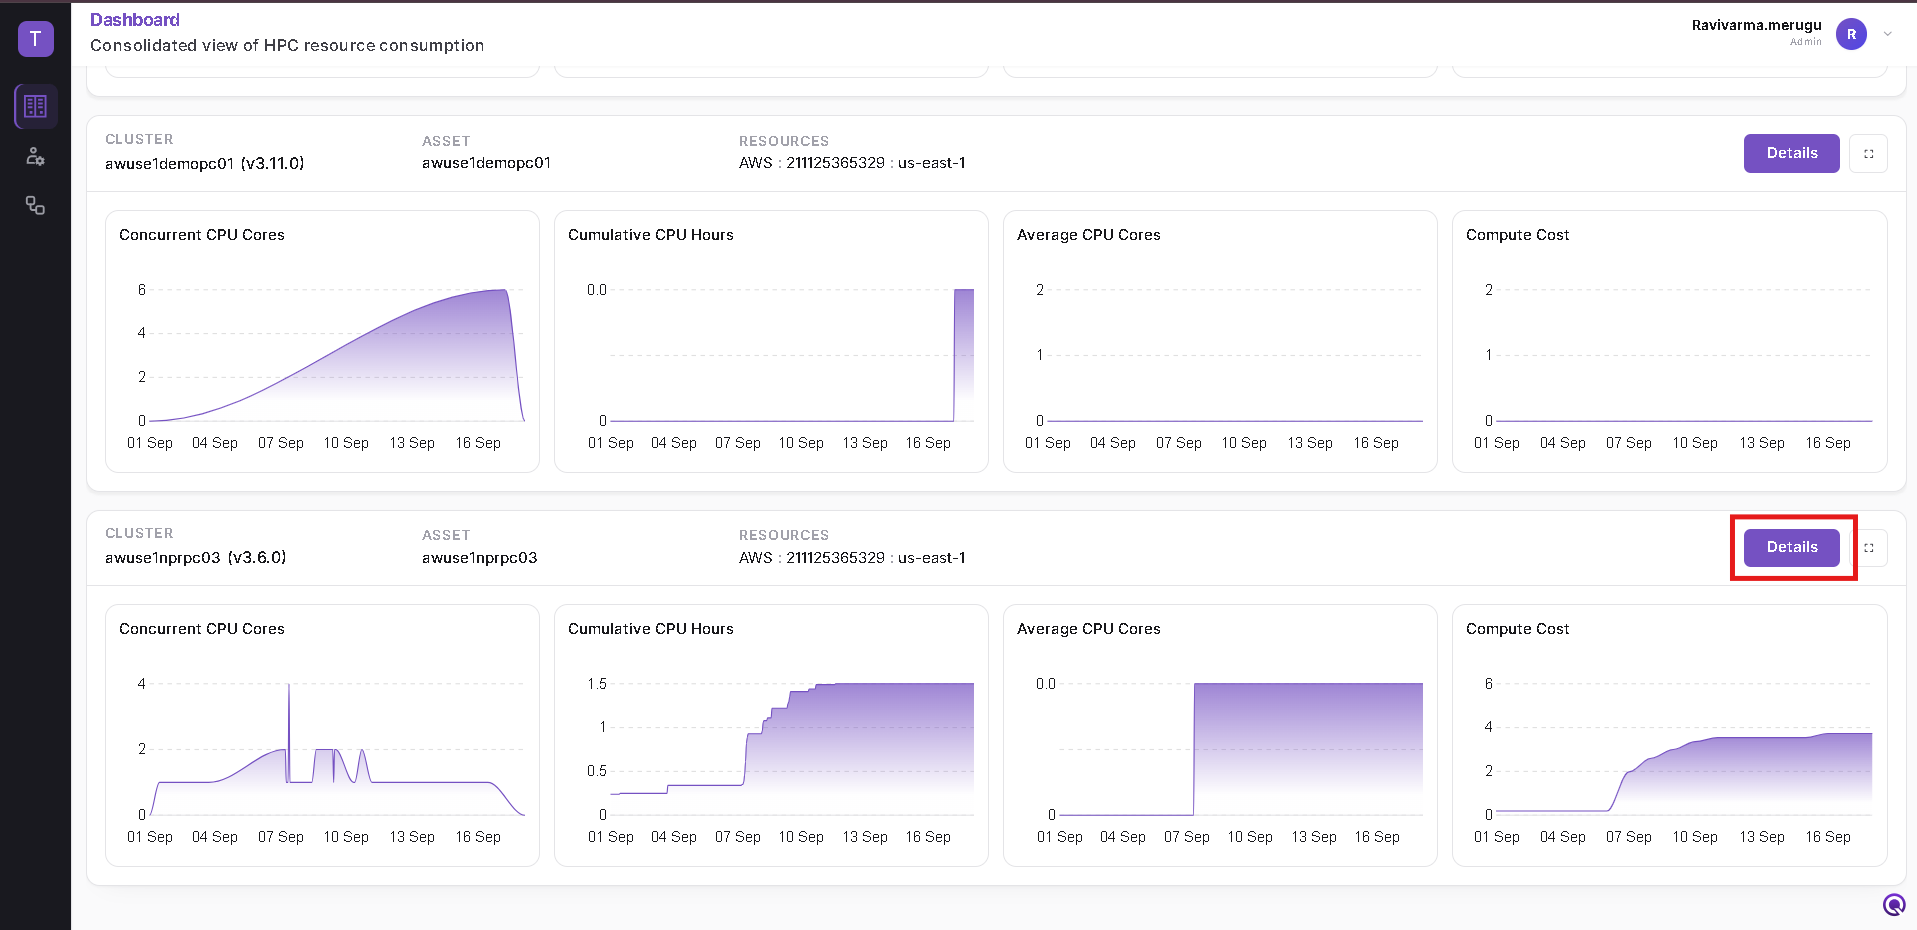
Scroll inside the Cluster Details window to review the following sections. Use the X at the top right to close the window.
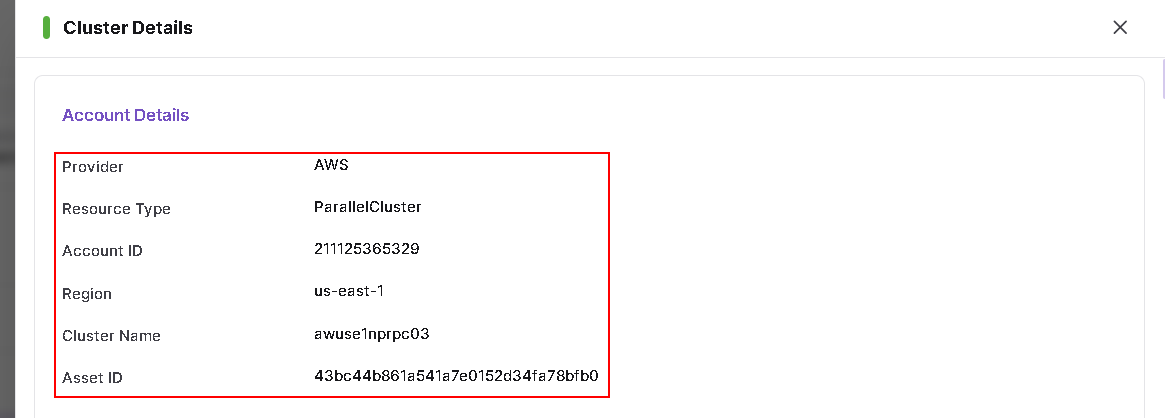
Account Details
Review the Provider, Resource Type, Account ID, Region, Cluster Name, and Asset ID to identify the selected cluster and its cloud account.
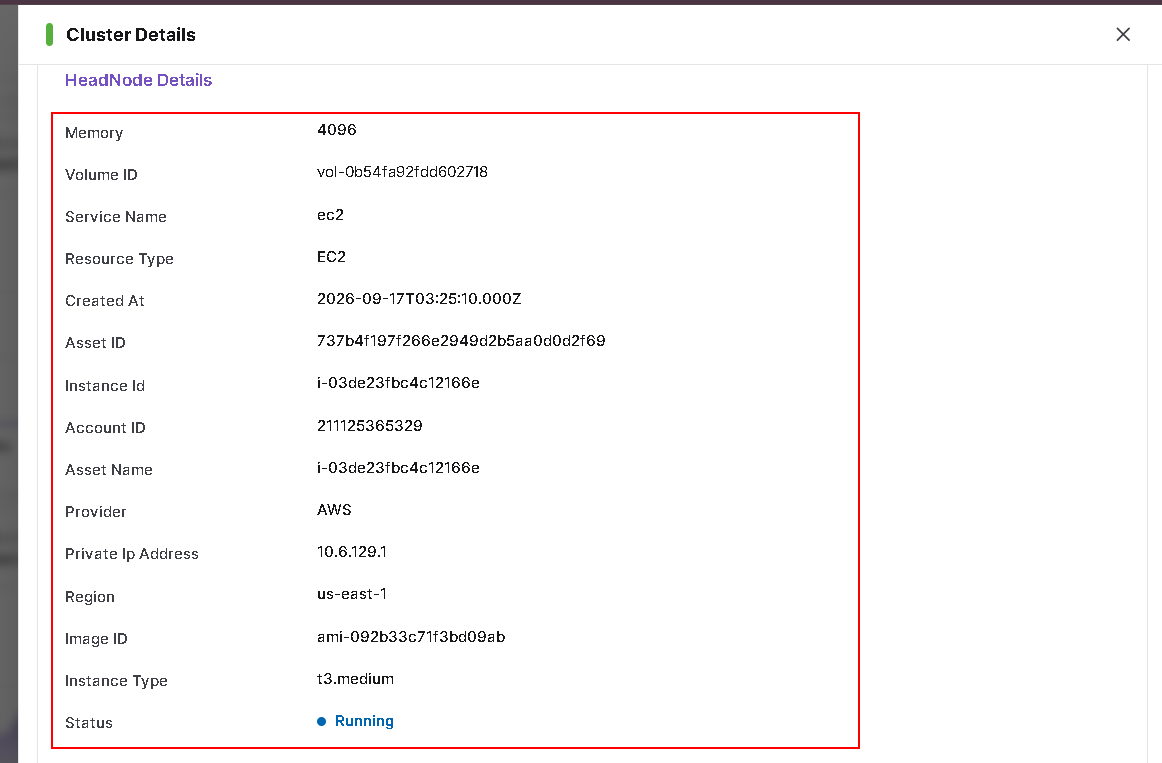
HeadNode Details
This section shows the head node's resource information, including:
- Memory, volume ID, instance ID, image ID, and instance type.
- Service name, resource type, asset ID, and asset name.
- Account ID, provider, region, and private IP address.
- Creation timestamp and status.
Cluster Configuration
Review the cluster's configured settings:
| Area | Fields shown |
|---|---|
| System and scheduling | Cluster name, OS, queue type, instance type, scale-down idle time, and simultaneous multithreading setting. |
| Network and access | Allowed IPs, subnet ID, key name, policies, and IMDS support. |
| Monitoring | CloudWatch dashboard and logs settings, log retention and deletion policy, and detailed monitoring. |
| Storage | Volume type, volume size, and encryption setting. |
| Scripts and S3 | On Node Updated Script, On Node Configured Script, S3 bucket name, and write-access setting. |
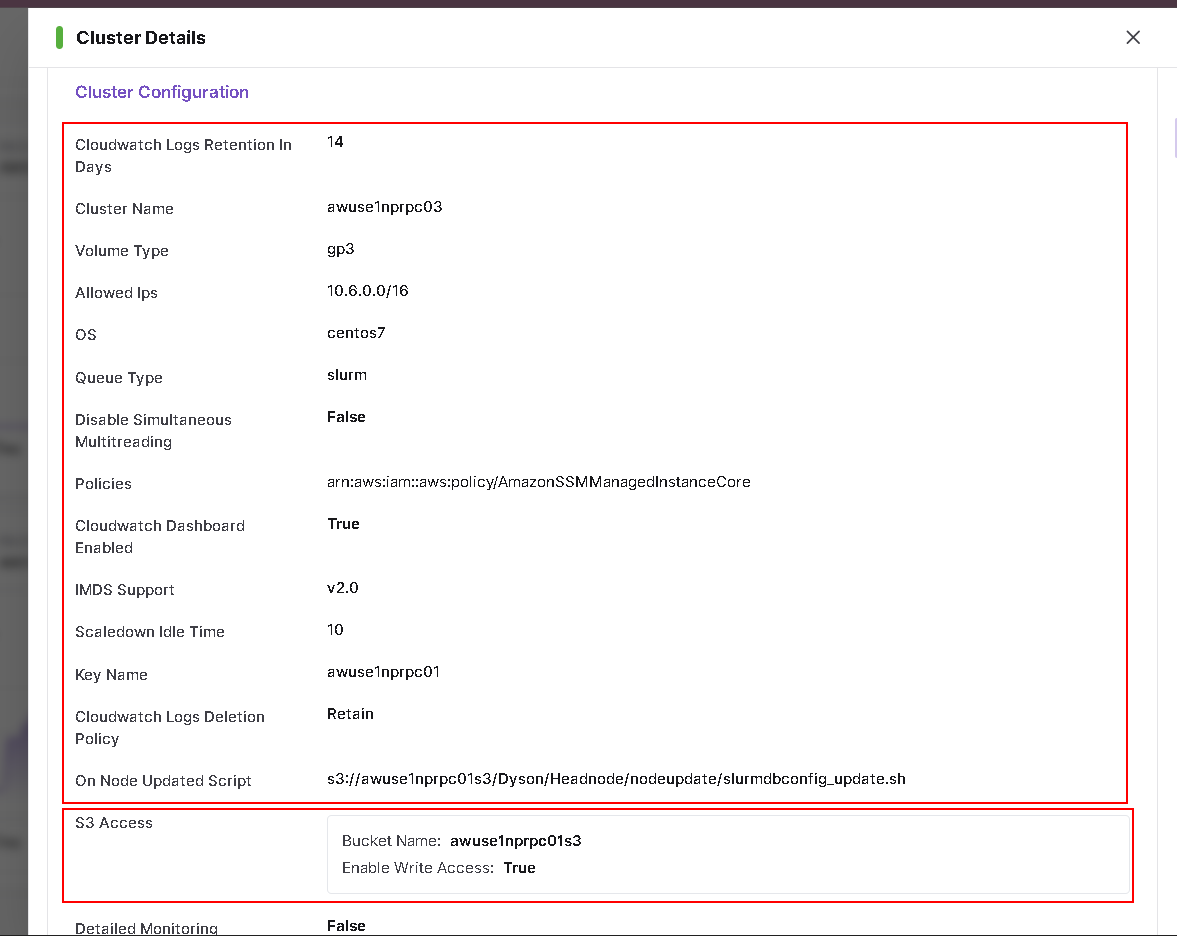
Scroll down for the remaining configuration fields and Database Configuration.
Database Configuration
This section lists the database's resource and connection information: asset ARN, user name, service name, resource type, asset ID and name, database address, endpoint, account ID, port, provider, region, and password secret ARN.
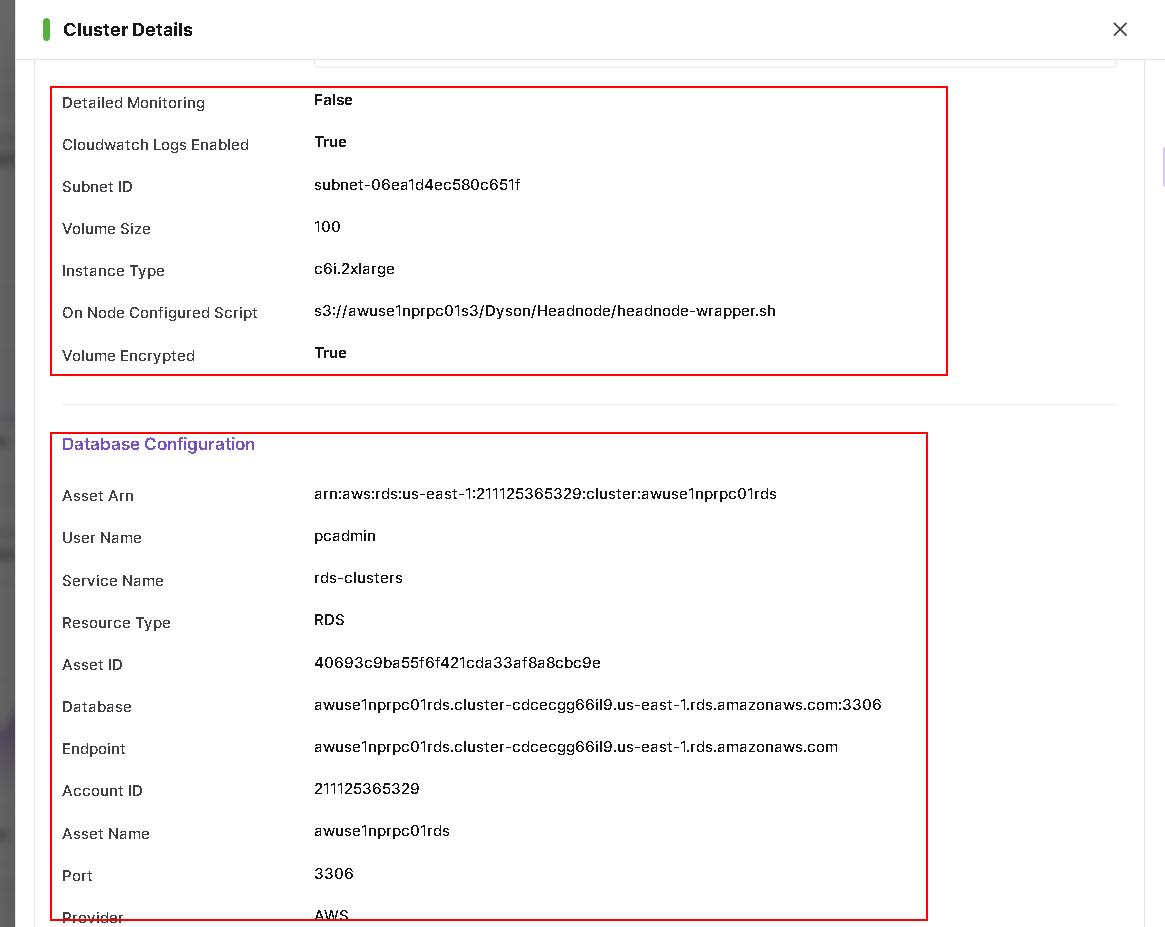
The remaining database fields appear immediately above Queue Configuration.
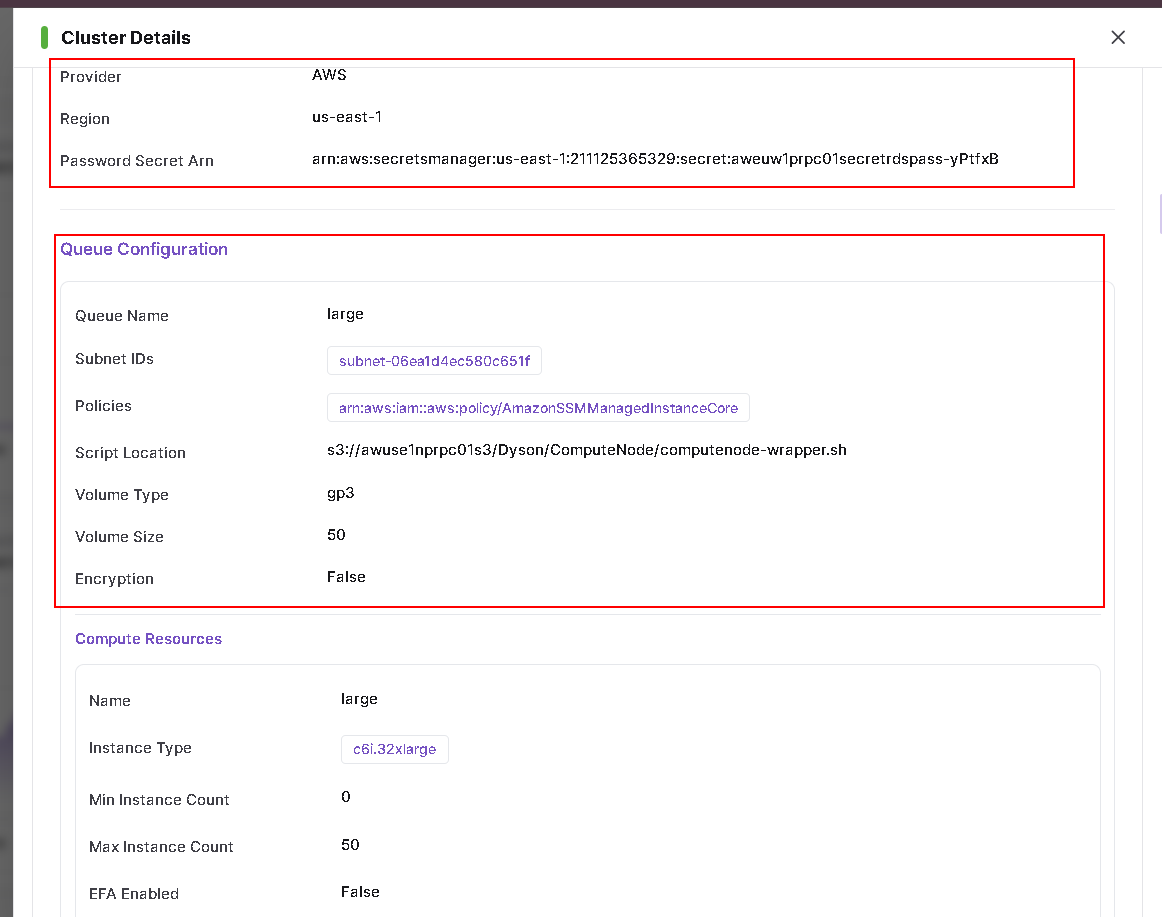
Queue Configuration
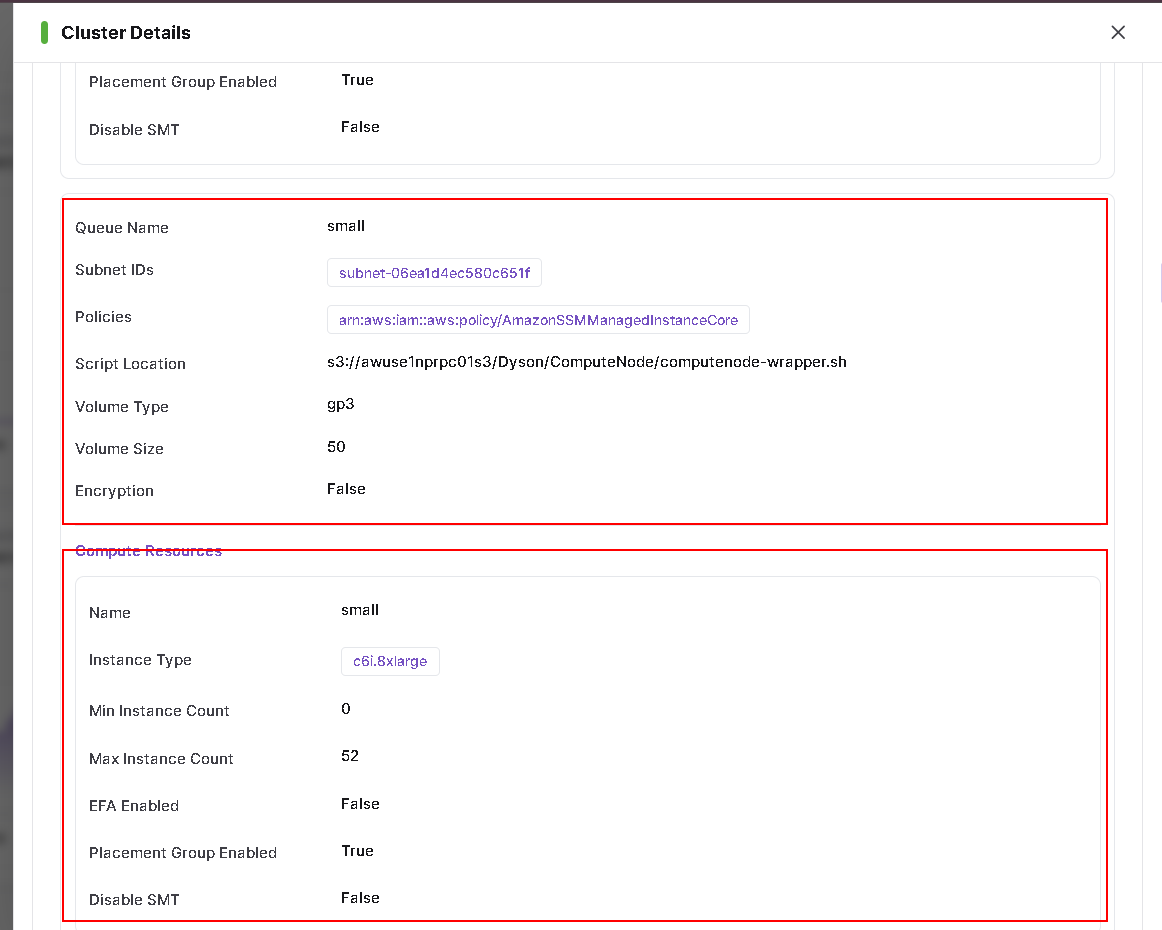
Each configured queue has its own entry. Scroll through the entries to review the queue you need.
| Area | Fields shown |
|---|---|
| Queue configuration | Queue name, subnet IDs, policies, script location, volume type, volume size, and encryption. |
| Compute Resources | Resource name, instance type, minimum and maximum instance counts, EFA Enabled, Placement Group Enabled, and Disable SMT. |
A queue can contain more than one Compute Resources entry. Review each entry where applicable. The screenshot below shows one queue as an example; its values are specific to this cluster.
Storage Configuration
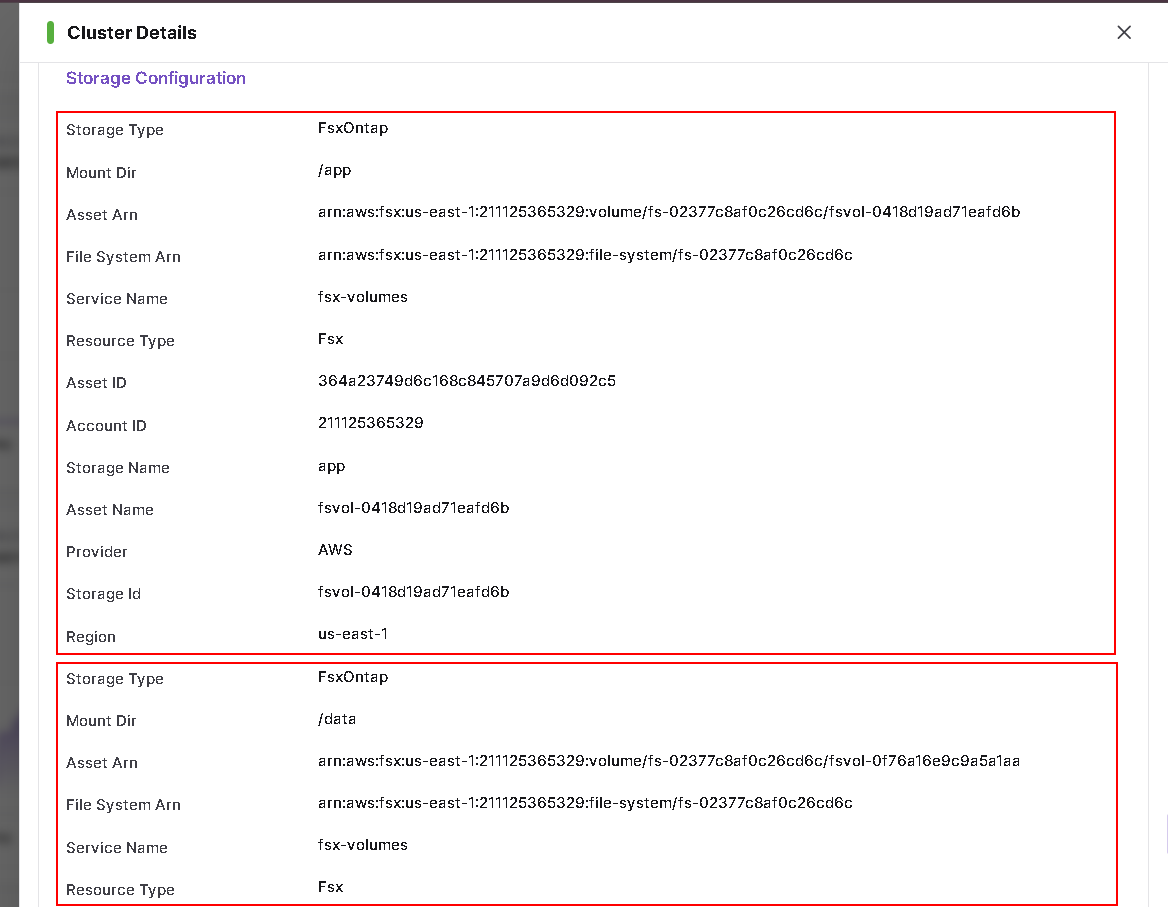
Review the storage resources and their mount directories. The example cluster includes /app, /data, and /shared mounts.
The displayed fields include storage type, mount directory, asset ARN, file system ARN, service name, resource type, asset ID, account ID, storage name, asset name, provider, storage ID, and region.
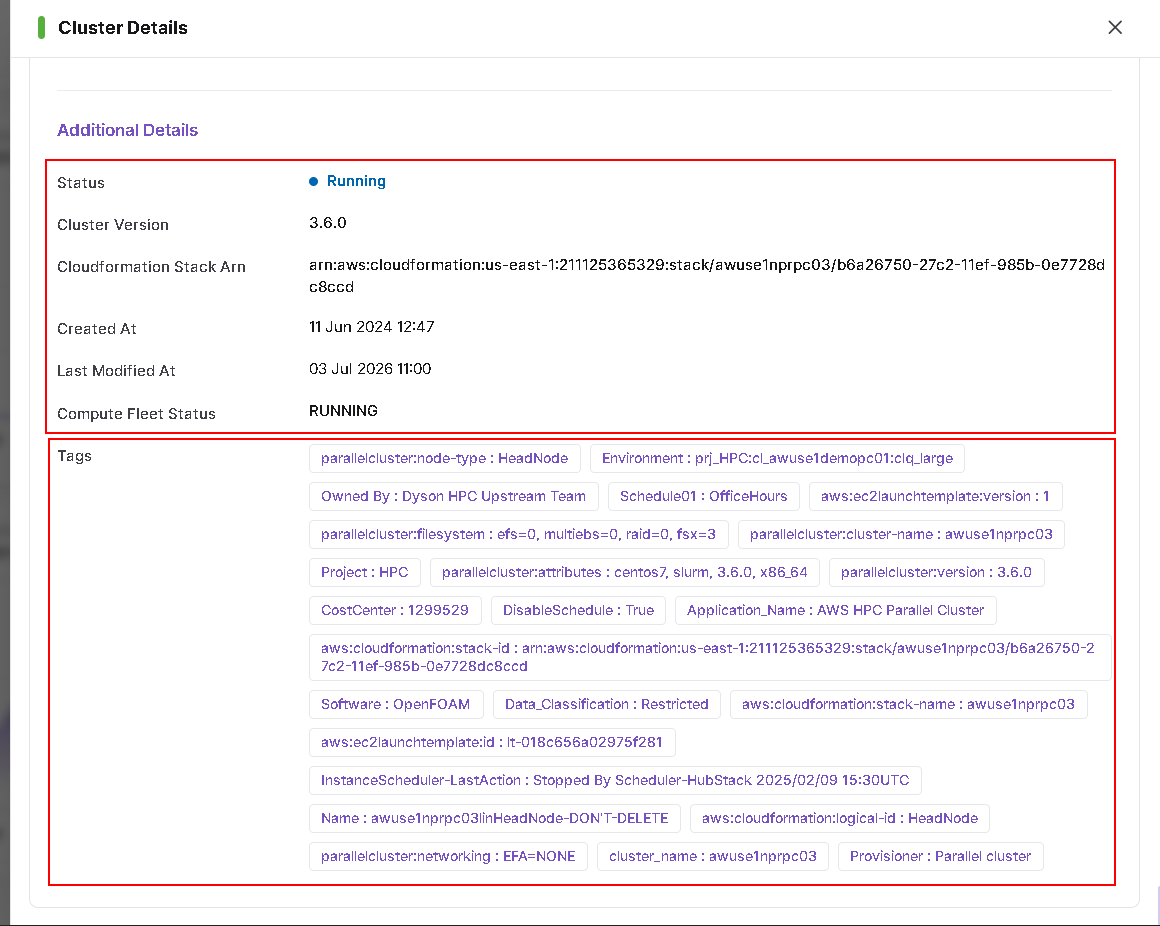
Additional Details
Review the cluster Status, Cluster Version, Cloudformation Stack Arn, Created At, Last Modified At, Compute Fleet Status, and Tags.
Open the Expanded Metrics View
- Close Cluster Details if it is open.
- On the same cluster card, click the expand icon beside Details.
- Scroll through the cluster metrics window to review the sections below.
Recent Jobs and Workstation Status
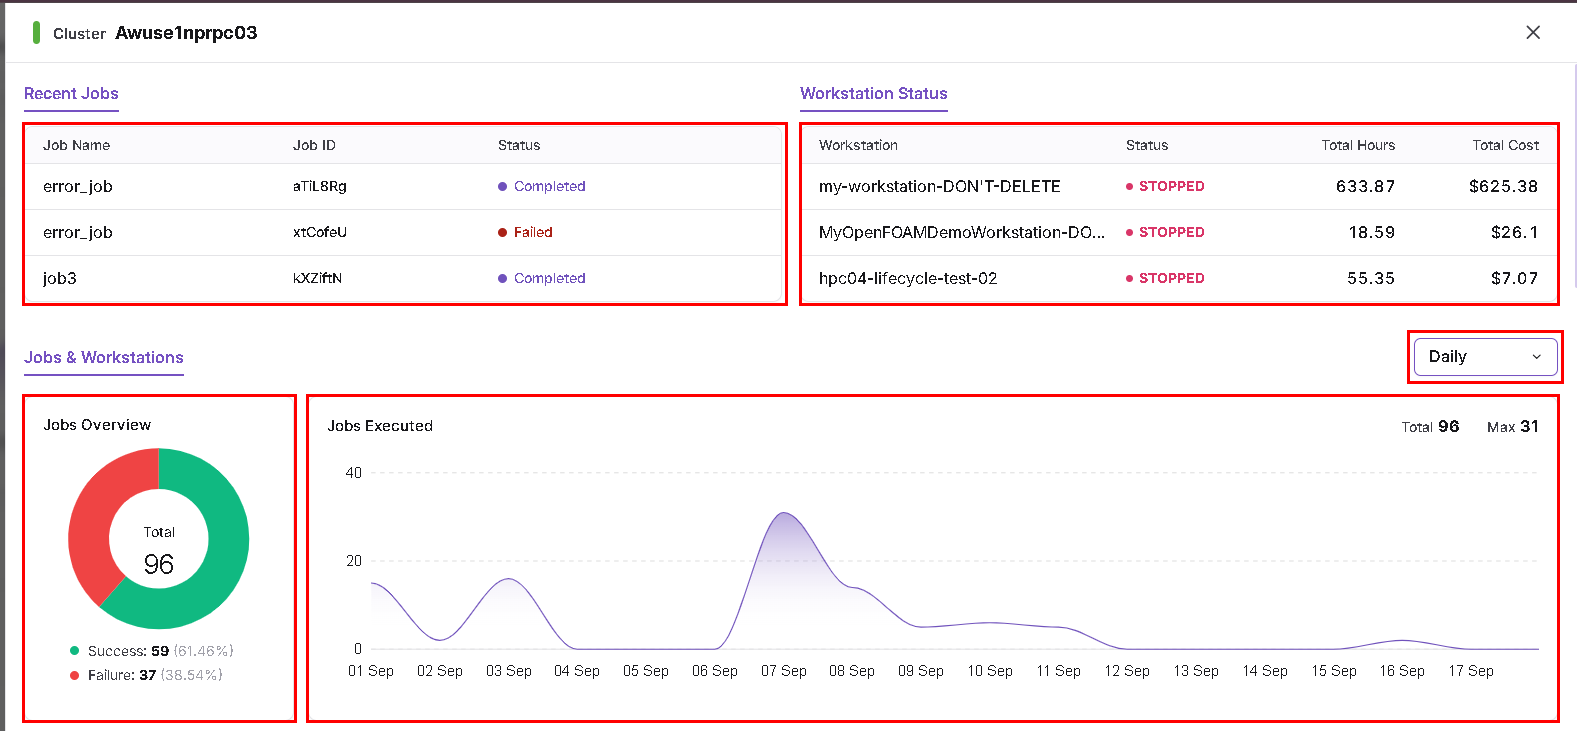
Recent Jobs lists Job Name, Job ID, and Status.
Workstation Status lists Workstation, Status, Total Hours, and Total Cost.
Jobs & Workstations
The Jobs Overview chart shows the total jobs and the success/failure breakdown. Jobs Executed shows the execution trend, with total and maximum values displayed above the chart.
The interval selector appears at the upper right of this section; Daily is selected in the example.
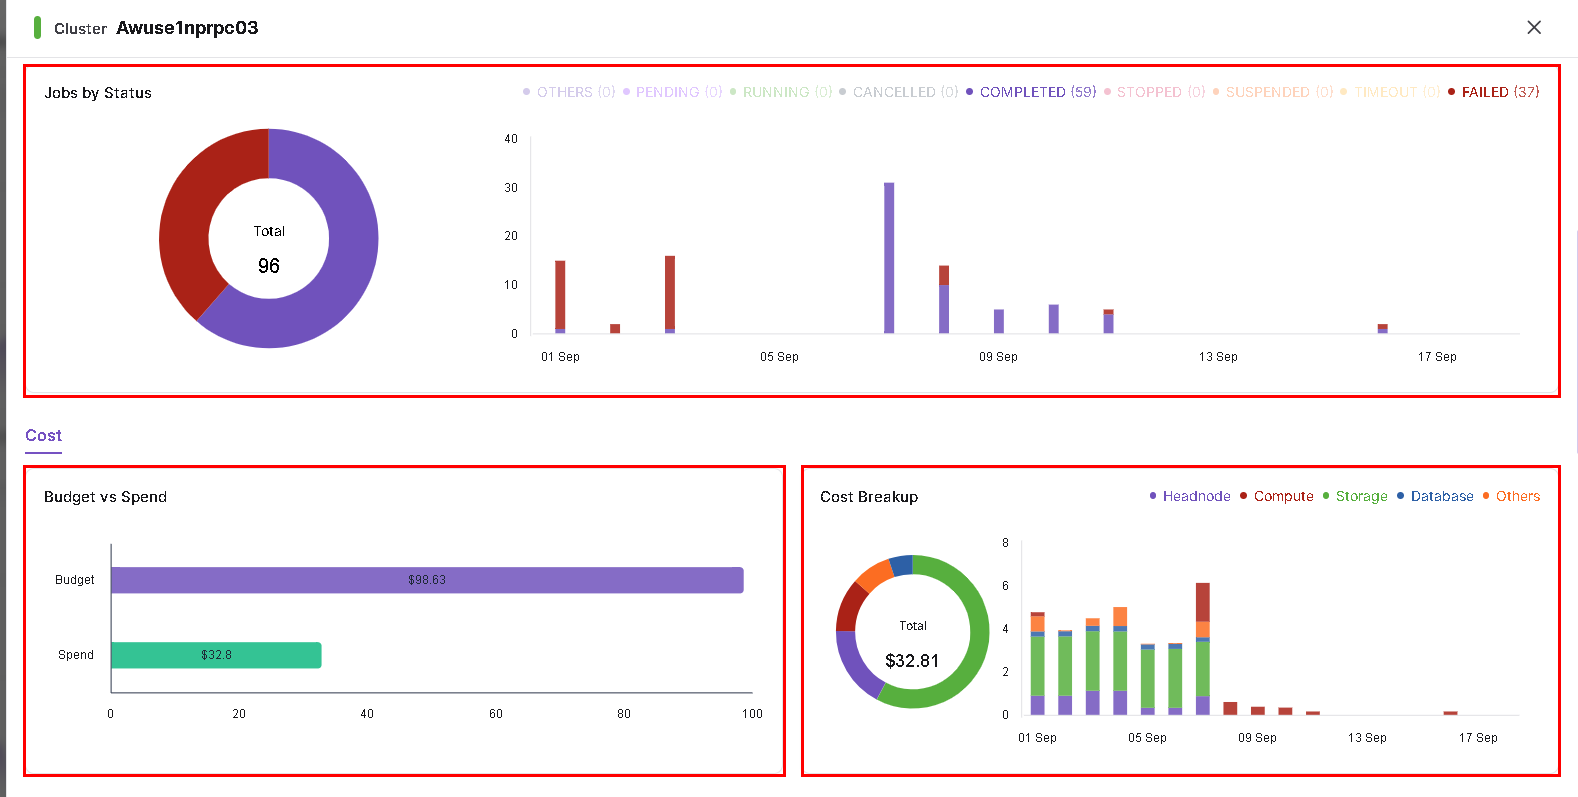
Scroll down to Jobs by Status to see the status distribution and its trend. The legend identifies the statuses represented in the charts.
Cost
- Budget vs Spend compares the displayed budget and spend.
- Cost Breakup shows costs grouped into Headnode, Compute, Storage, Database, and Others, with a total and a trend chart.
Resources
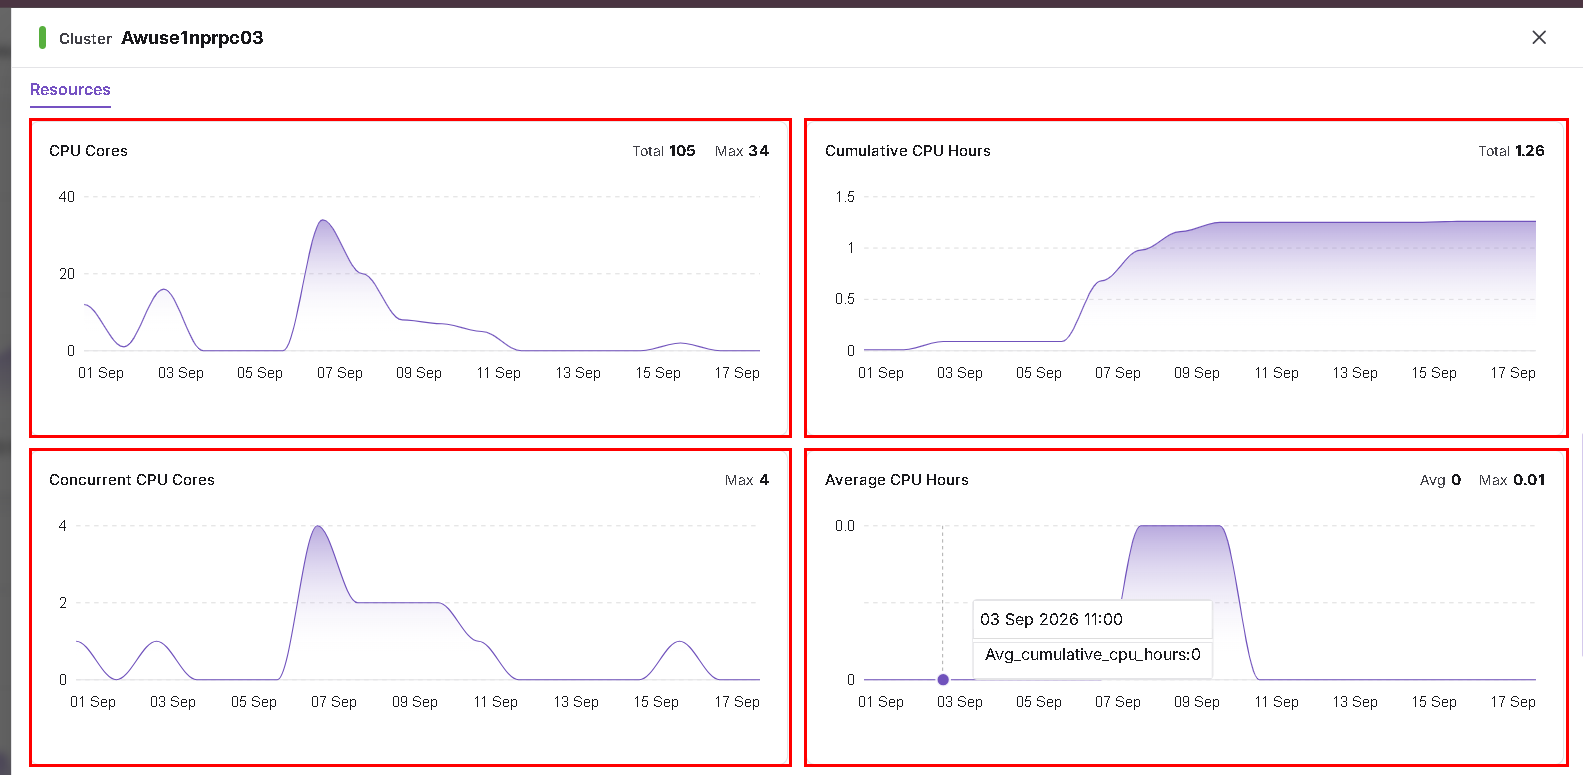
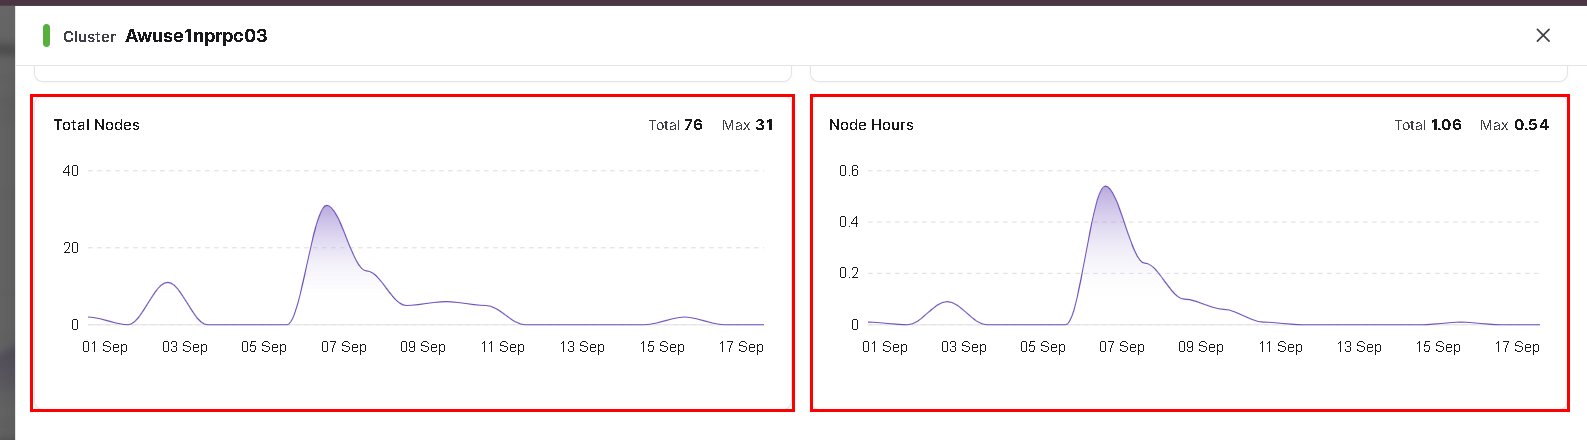
The Resources section contains the following charts:
- CPU Cores
- Cumulative CPU Hours
- Concurrent CPU Cores
- Average CPU Hours
- Total Nodes
- Node Hours
Review the totals, maximums, or averages shown on each chart. Hover over a data point to inspect its value and timestamp.
Resource Report Table
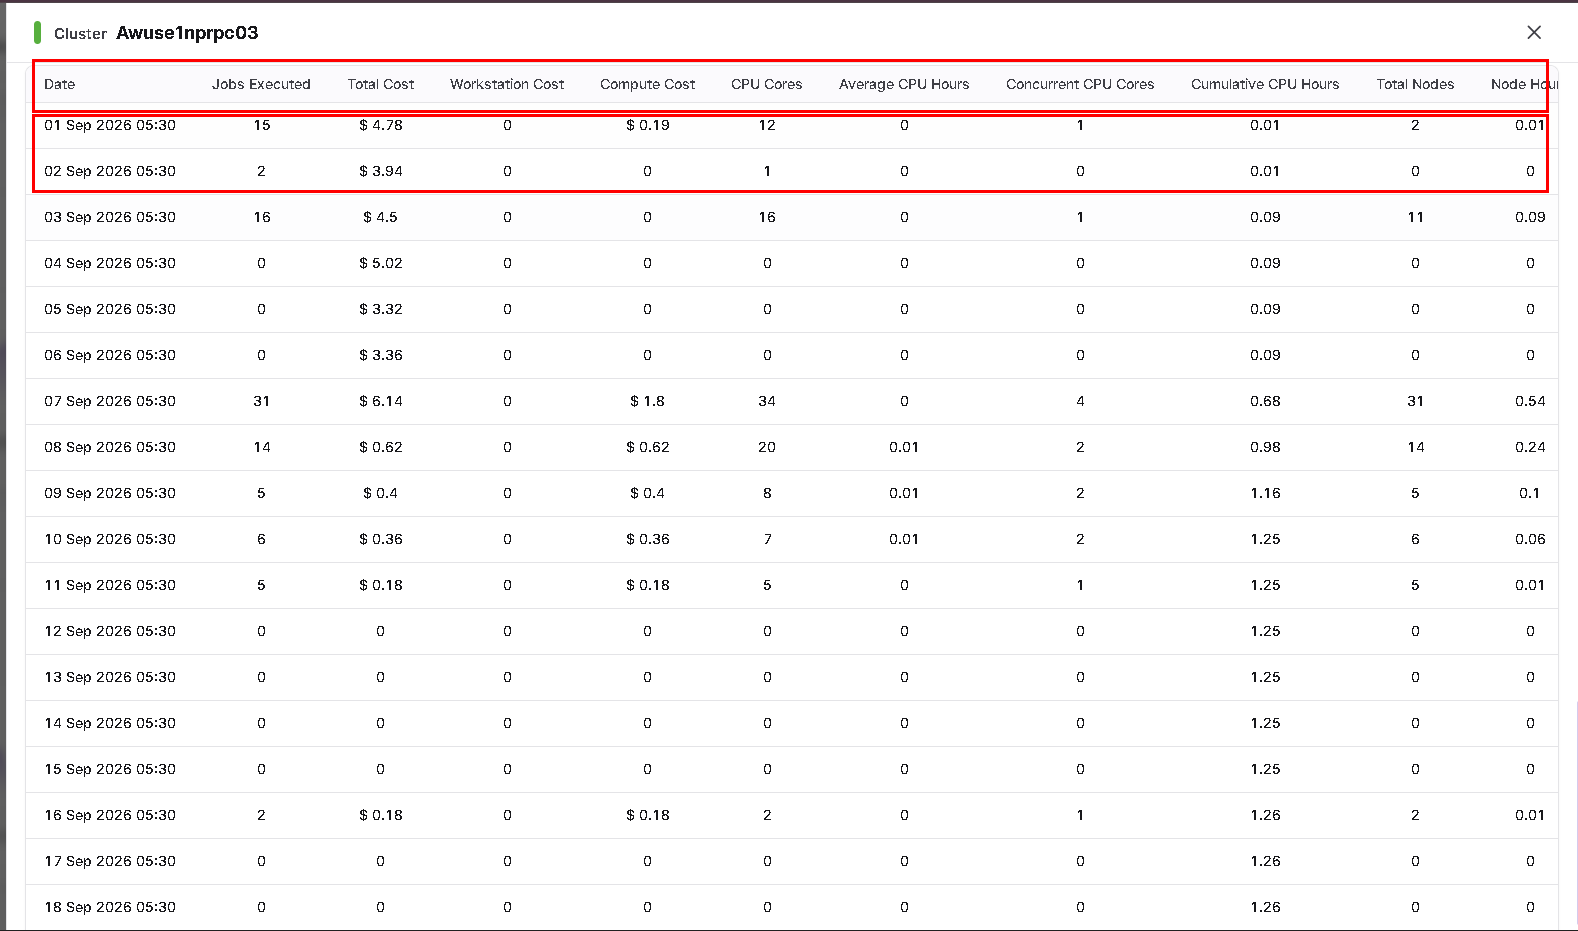
Scroll below the charts to review the report table. The example shows daily rows with these columns:
| Category | Columns |
|---|---|
| Date and activity | Date, Jobs Executed |
| Cost | Total Cost, Workstation Cost, Compute Cost |
| CPU | CPU Cores, Average CPU Hours, Concurrent CPU Cores, Cumulative CPU Hours |
| Nodes | Total Nodes, Node Hours |
Use the X at the top right to close the metrics window and return to the Dashboard.