Job Analytics
The Analytics tab in the Jobs page provides administrators with insights into job recommendation usage, efficiency patterns, and user selection behavior. This view helps track how users follow or override platform recommendations and how efficiently jobs are being configured.
Access Job Analytics
- Navigate to Jobs from the left navigation menu.
- In the Jobs page, click the Analytics tab.
- Use the top filters such as Provider, Account, Region, Type, and Cluster as needed.
- Use the date range selector on the right side to load analytics data for the required time period.
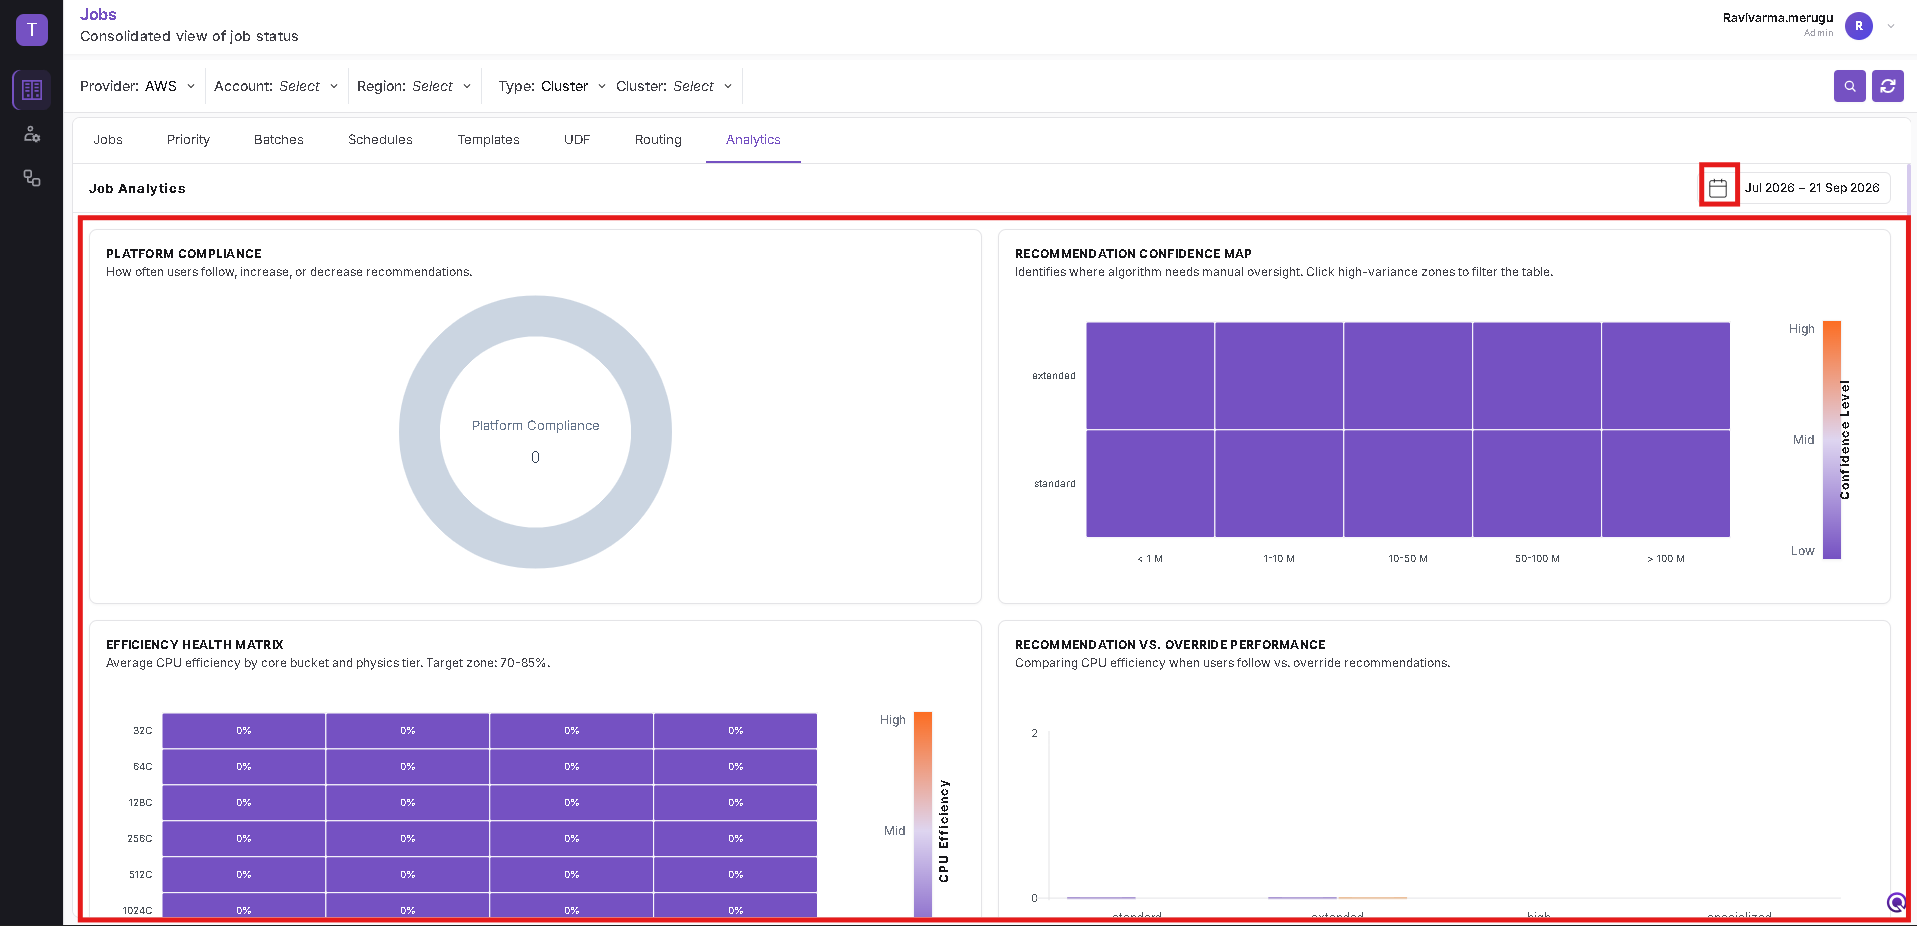
Analytics sections
The Analytics dashboard includes the following sections:
Platform Compliance
This chart shows how often users follow, increase, or decrease the recommendations provided by the platform.
Recommendation Confidence Map
This heatmap shows the confidence level of recommendations across different mesh-size ranges and physics complexity levels. It helps identify areas where manual review may be needed.
Efficiency Health Matrix
This matrix displays average CPU efficiency grouped by core bucket and physics tier. It helps administrators understand how efficiently jobs are utilizing compute resources.
Recommendation vs. Override Performance
This chart compares CPU efficiency when users follow the recommendation versus when they override it.
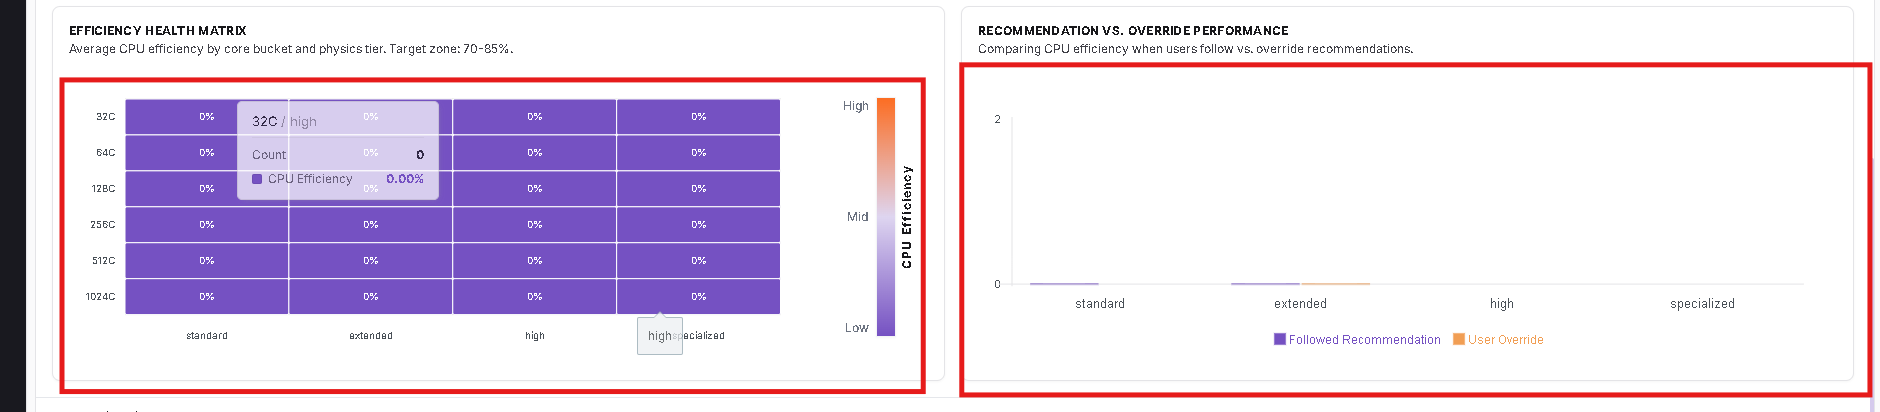
View analytics job records
The lower section of the Analytics tab contains a detailed table of analyzed jobs. This table includes the following information:
- Job ID
- Job Name
- User
- Selection Type
- Recommendation
- User Selection
- Efficiency
- Mesh Size
- Physics Complexity
Use this table to review how each job was configured and whether the recommendation was accepted or overridden.

Notes
- The Analytics tab is available only for the Administrator role.
- Analytics data depends on historical job activity and recommendation data.
- If no data is available for the selected filters or date range, the charts may appear empty.