Cluster Overview
The Cluster Details page provides a consolidated view of clusters, their compute resources, tags, and operational status.
Navigate to HPC → Cluster → Clusters.
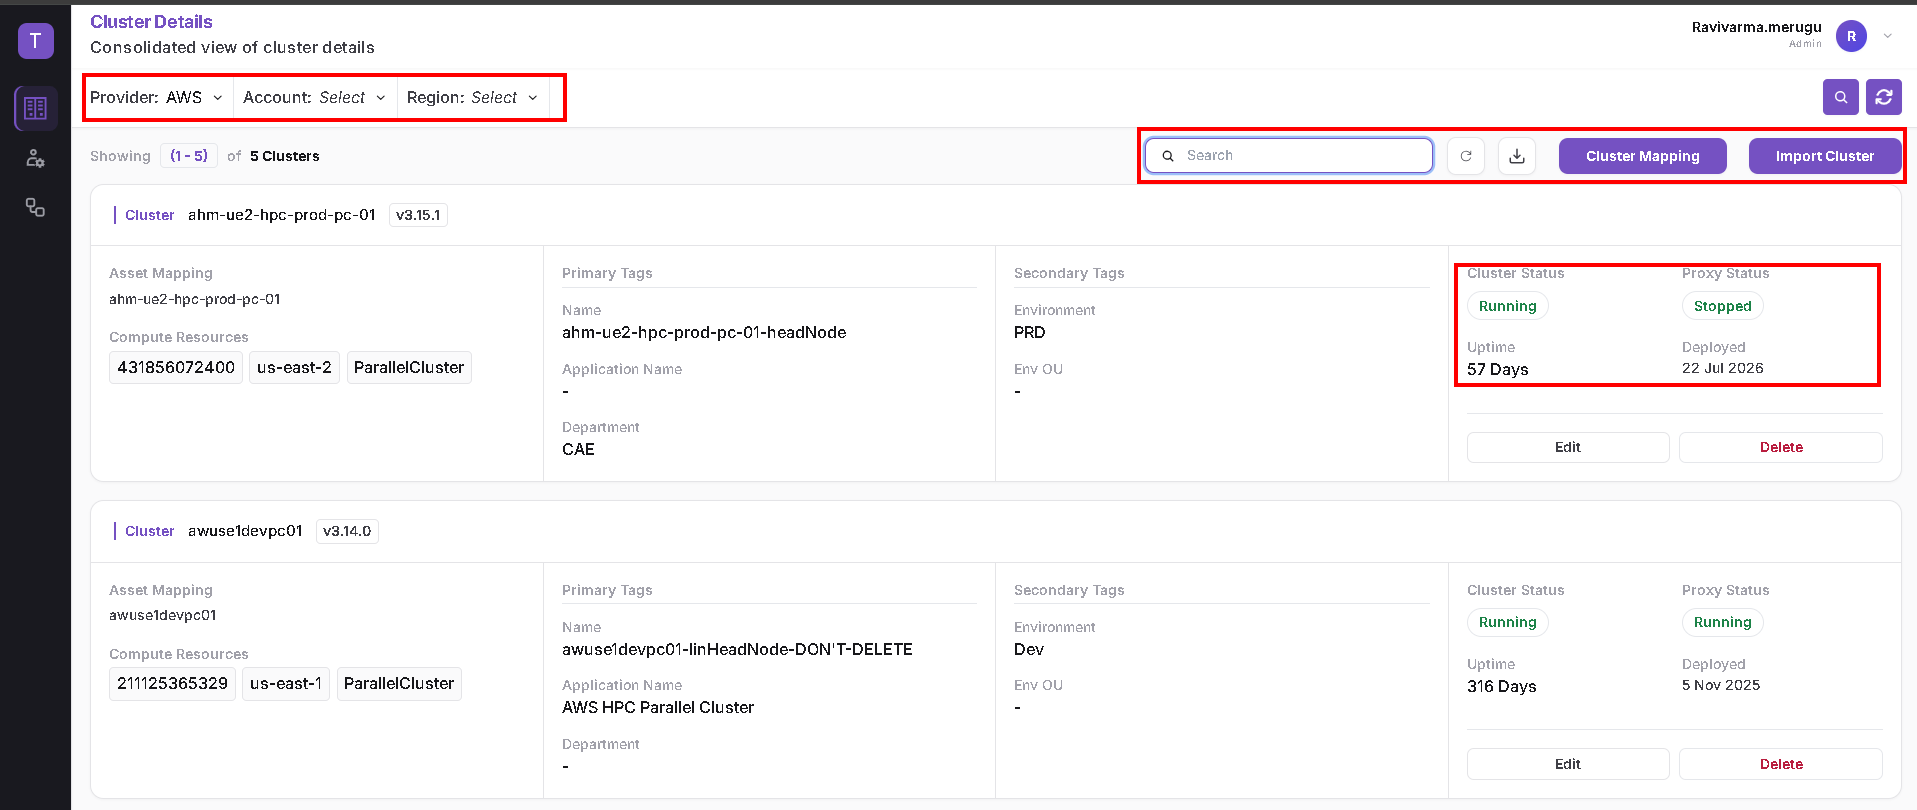
Filter and Find Clusters
Use the filters at the top of the page to select:
- Provider
- Account
- Region
Click the magnifying-glass button beside the filters to apply the selected scope.
The cluster list toolbar includes:
- A Search field for finding clusters.
- A refresh button.
- A download button.
- Cluster Mapping.
- Import Cluster.
The count above the list shows the displayed range and total number of clusters.
Cluster Card
Each cluster card displays the following information:
| Section | Information |
|---|---|
| Cluster header | Cluster name and version |
| Asset Mapping | Associated asset name |
| Compute Resources | Account ID, region, and resource type |
| Primary Tags | Name, Application Name, and Department |
| Secondary Tags | Environment and Env OU |
| Cluster Status | Displayed state of the cluster |
| Proxy Status | Displayed state of the proxy |
| Uptime | Reported uptime |
| Deployed | Deployment date |
Cluster Status and Proxy Status are displayed separately. Review both values when checking a cluster.
The card also provides Edit and Delete actions.
Open Cluster Resources
- Locate the required cluster card.
- Hover over the card to reveal View Details in its upper-right corner.
- Click View Details.

The Cluster Resources side panel opens for the selected cluster.
The panel contains three tabs:
- Details: Account, head node, cluster configuration, database, queue configuration, storage, and additional metadata.
- Events: Recorded cluster events and their messages.
- Applications: Configured applications and their selected versions.
Scroll within the panel to view additional content. Click the X in the upper-right corner to close it.
Related Topics
Values shown in screenshots are examples and vary by cluster.