Dashboard Overview
The administrator Dashboard provides a consolidated view of HPC resource consumption. Use the Type dropdown to review activity by Cluster, Queue, User, or Project, then inspect details or expand a result to see its jobs, workstations, costs, and resource usage.
Open the Dashboard and Select a View
- Sign in with your administrator account and open HPC > Dashboard.
- Choose Cluster, Queue, User, or Project from Type.
- Select the required Provider, Account, and Region.
- Set the filters for the chosen view using the dropdown checkboxes.
- Choose the reporting period in the calendar, click Apply, then click Search beside the calendar to retrieve results.
| Type | Filters specific to the view | Result card |
|---|---|---|
| Cluster | Cluster | Cluster name and version, asset, and cloud resource information. |
| Queue | Queue and Cluster | Queue name, cluster name and version, and cloud resource information. |
| User | User and Cluster | User name, ID, and organization. |
| Project | Project and Cluster | Project name and resource provider. |
Dropdowns with checkboxes show the number of selected items. The available items and reported values depend on your environment, access, filters, and reporting period. Names and dates in this guide are examples.
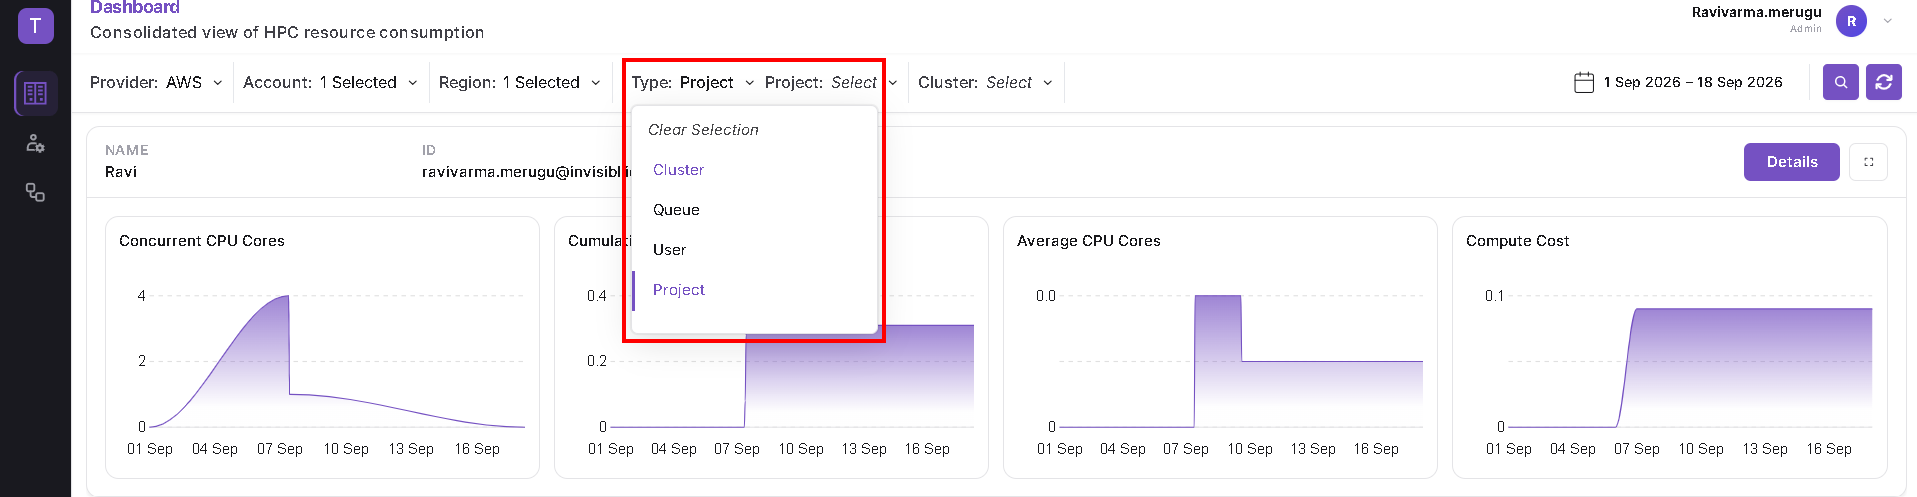
Changing a selection does not retrieve the new results by itself. Previously loaded cards may remain visible until you click Search. The selection screenshots in this guide show this intermediate state.
Choose Dates and Retrieve Results
These steps apply to all four Type options:
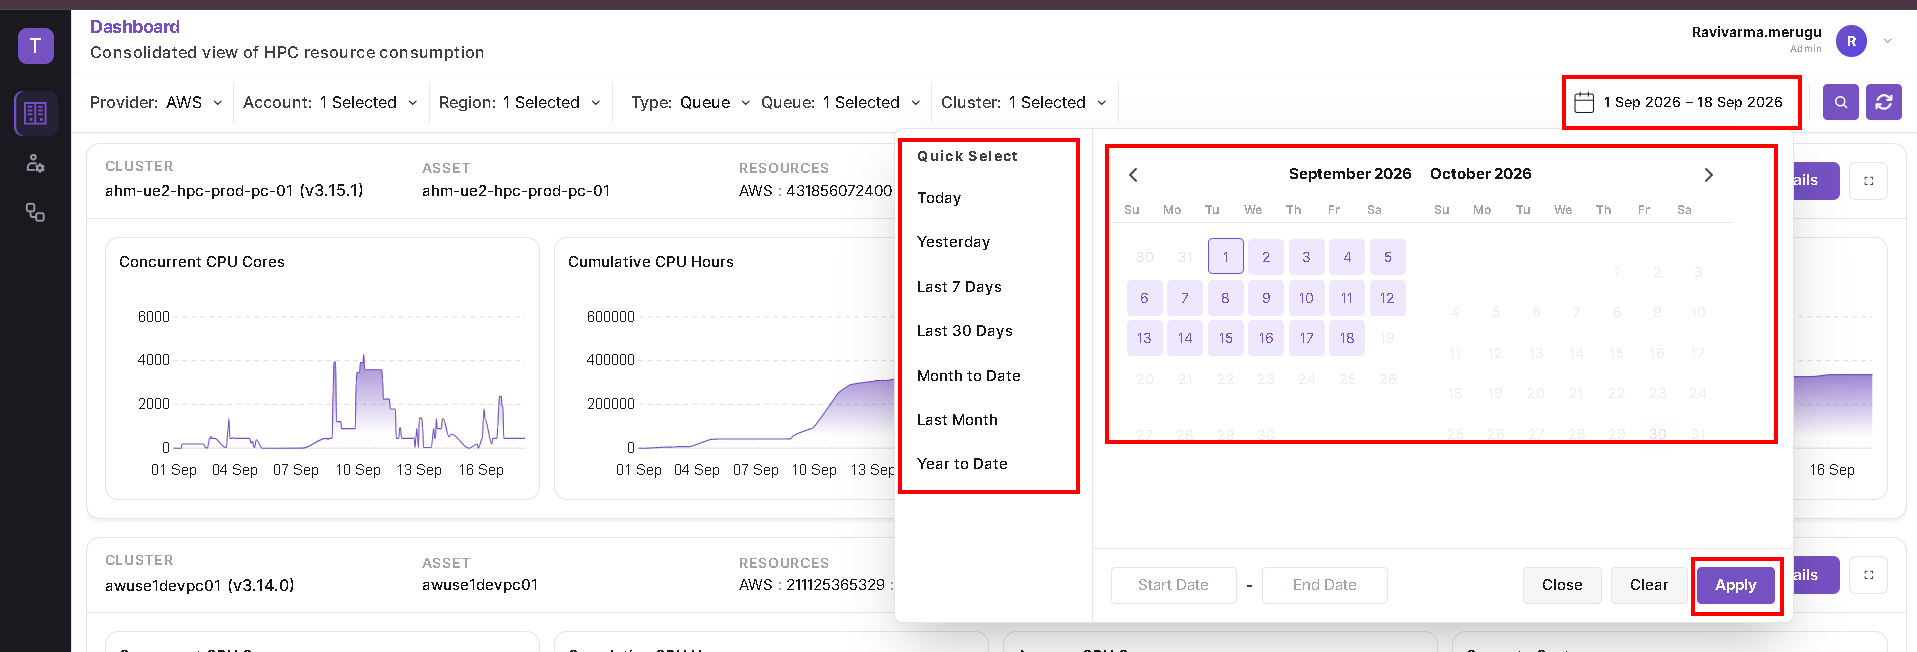
- Click the calendar/date-range control at the upper right.
- Choose the required start and end dates, or use Quick Select.
- Click Apply in the calendar.
- Click the purple Search button with the magnifying-glass icon, immediately to the right of the date range.
The Quick Select options shown are Today, Yesterday, Last 7 Days, Last 30 Days, Month to Date, Last Month, and Year to Date. The calendar also provides Close and Clear controls.
The highlighted Search button below applies the selected filters and reporting period to the results.
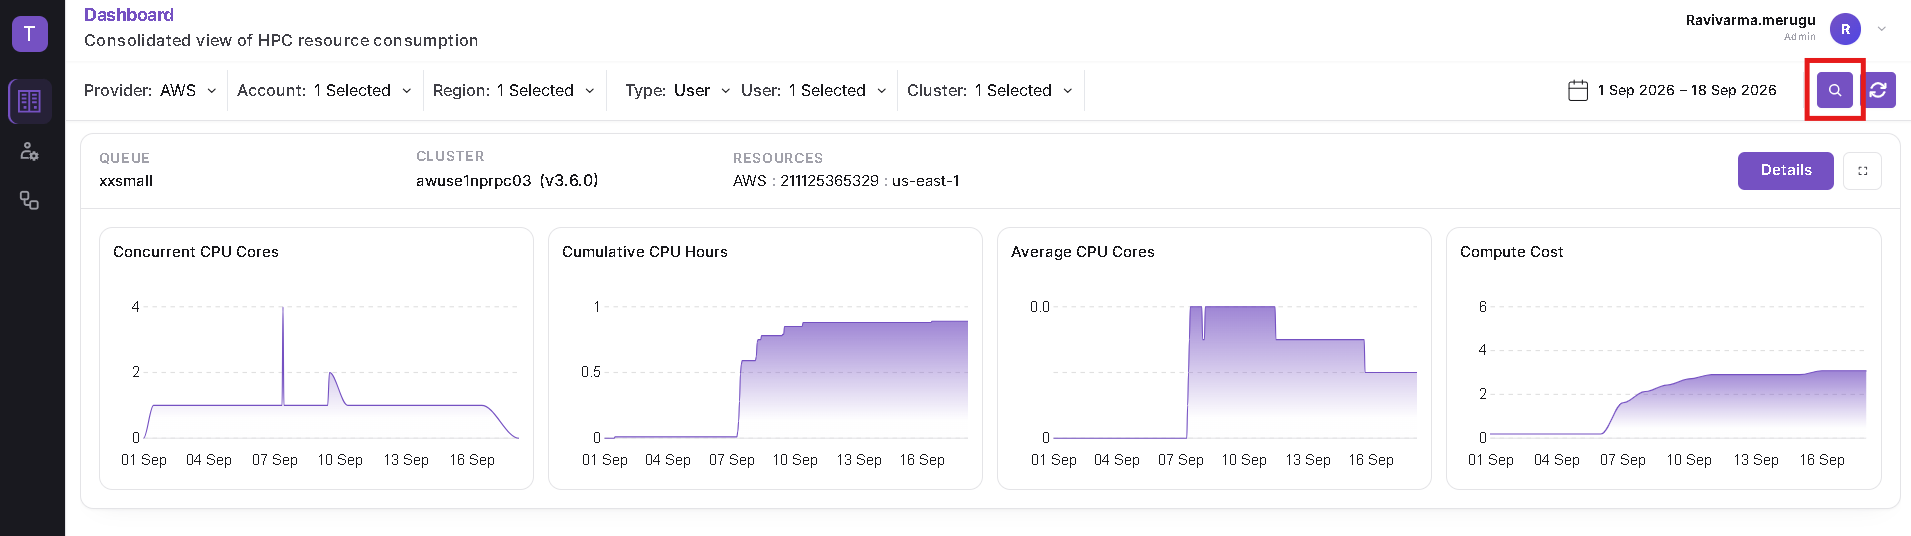
After changing any filter or reporting dates, click Search again. The adjacent circular-arrow Refresh button reloads the Dashboard data.
Read the Results
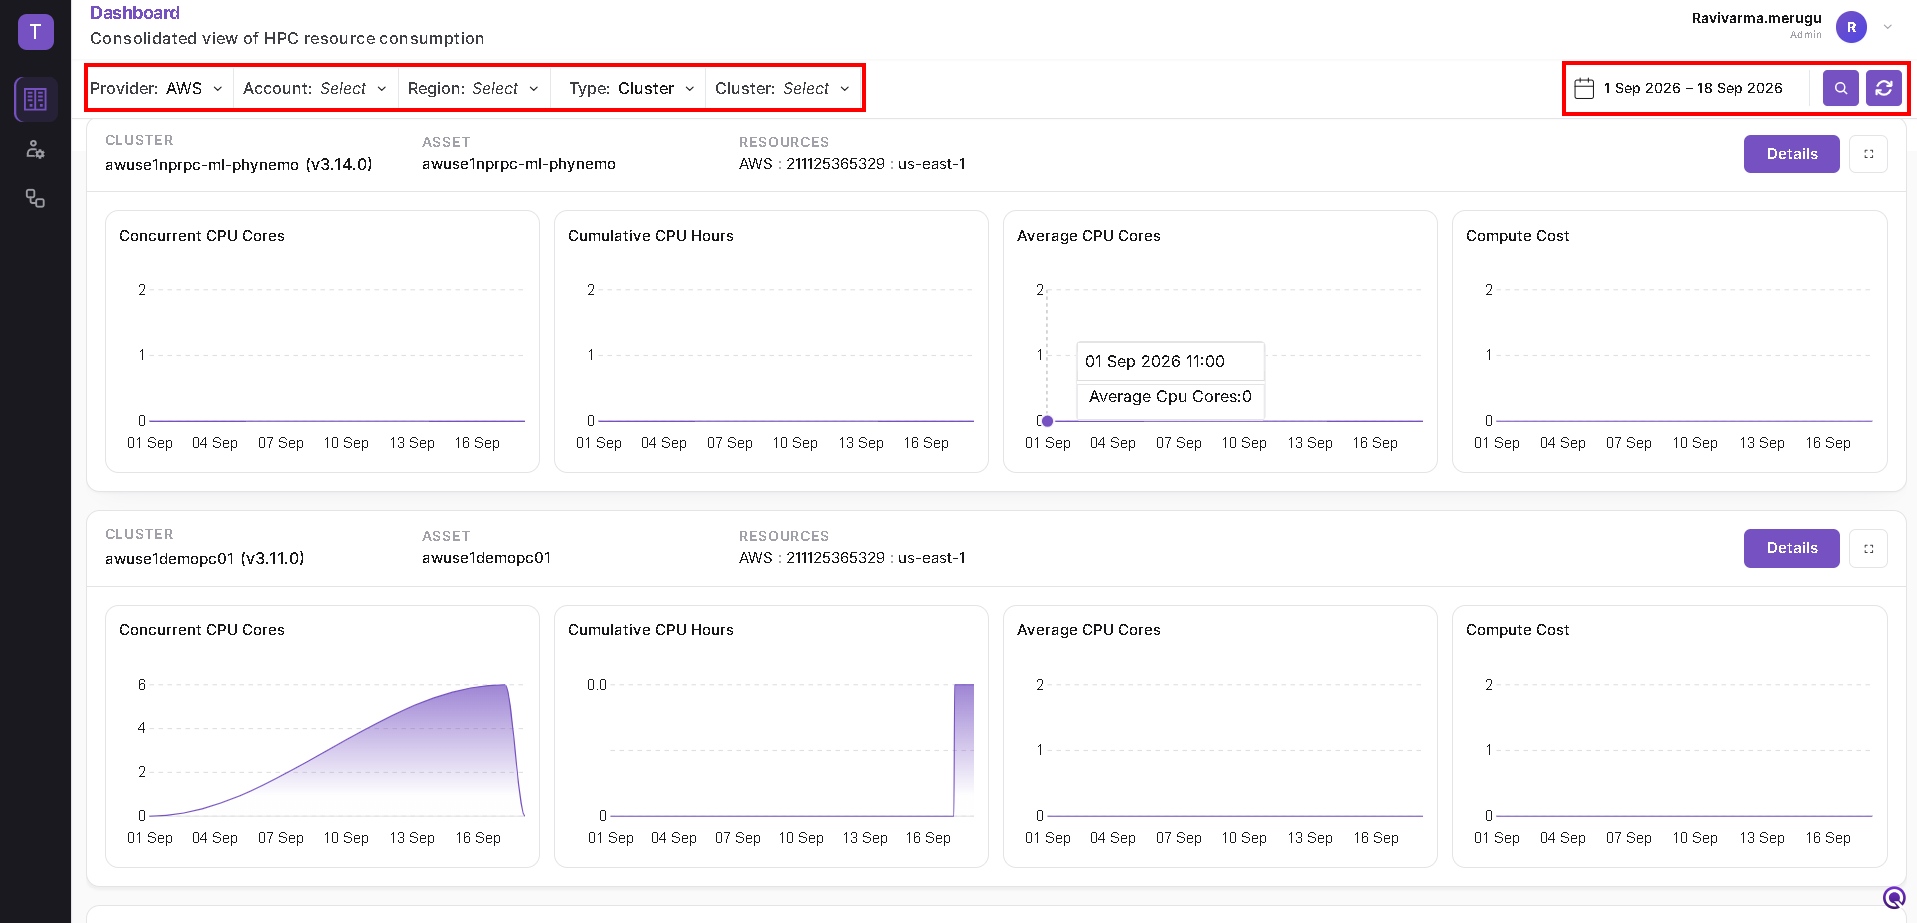
Each result card shows four summary charts:
- Concurrent CPU Cores
- Cumulative CPU Hours
- Average CPU Cores
- Compute Cost
Multiple cards can appear. Scroll to find the item you want to review. Hover over a chart to inspect a data point.
Details and Expanded Metrics
Each Type provides two separate actions on its result cards:
| Action | What opens |
|---|---|
| Details | Information about that cluster, queue, user, or project. The fields differ by Type. |
| Small expand icon beside Details | Jobs, workstation status, costs, CPU and node charts, and the resource report for the selected item. |
Close either window using X at the top right. To change the filters or dates, return to the Dashboard, update your selection, and click Search.
The expanded screenshots show Daily selected. The summary card label Average CPU Cores and expanded chart label Average CPU Hours are different labels in the current interface.
Complete Workflows
- Cluster View: cluster configuration and expanded metrics.
- Queue View: queue capacity, configuration, and expanded metrics.
- User View: user identity, account status, and expanded metrics within the administrator Dashboard.
- Project View: project details and expanded metrics.